GPU & RDMA Joint Allocation
Introduction
In the AI model training scenario, collective communication between GPUs is involved, which may occur across nodes. To improve network communication speed, NICs that support the RDMA protocol are widely used in AI training scenarios.
Since v1.5.0, Koordinator has implemented joint scheduling capabilities for GPU and RDMA. In version v1.6.0, Koordinator provides an end-to-end solution for this. The overall architecture is as follows:
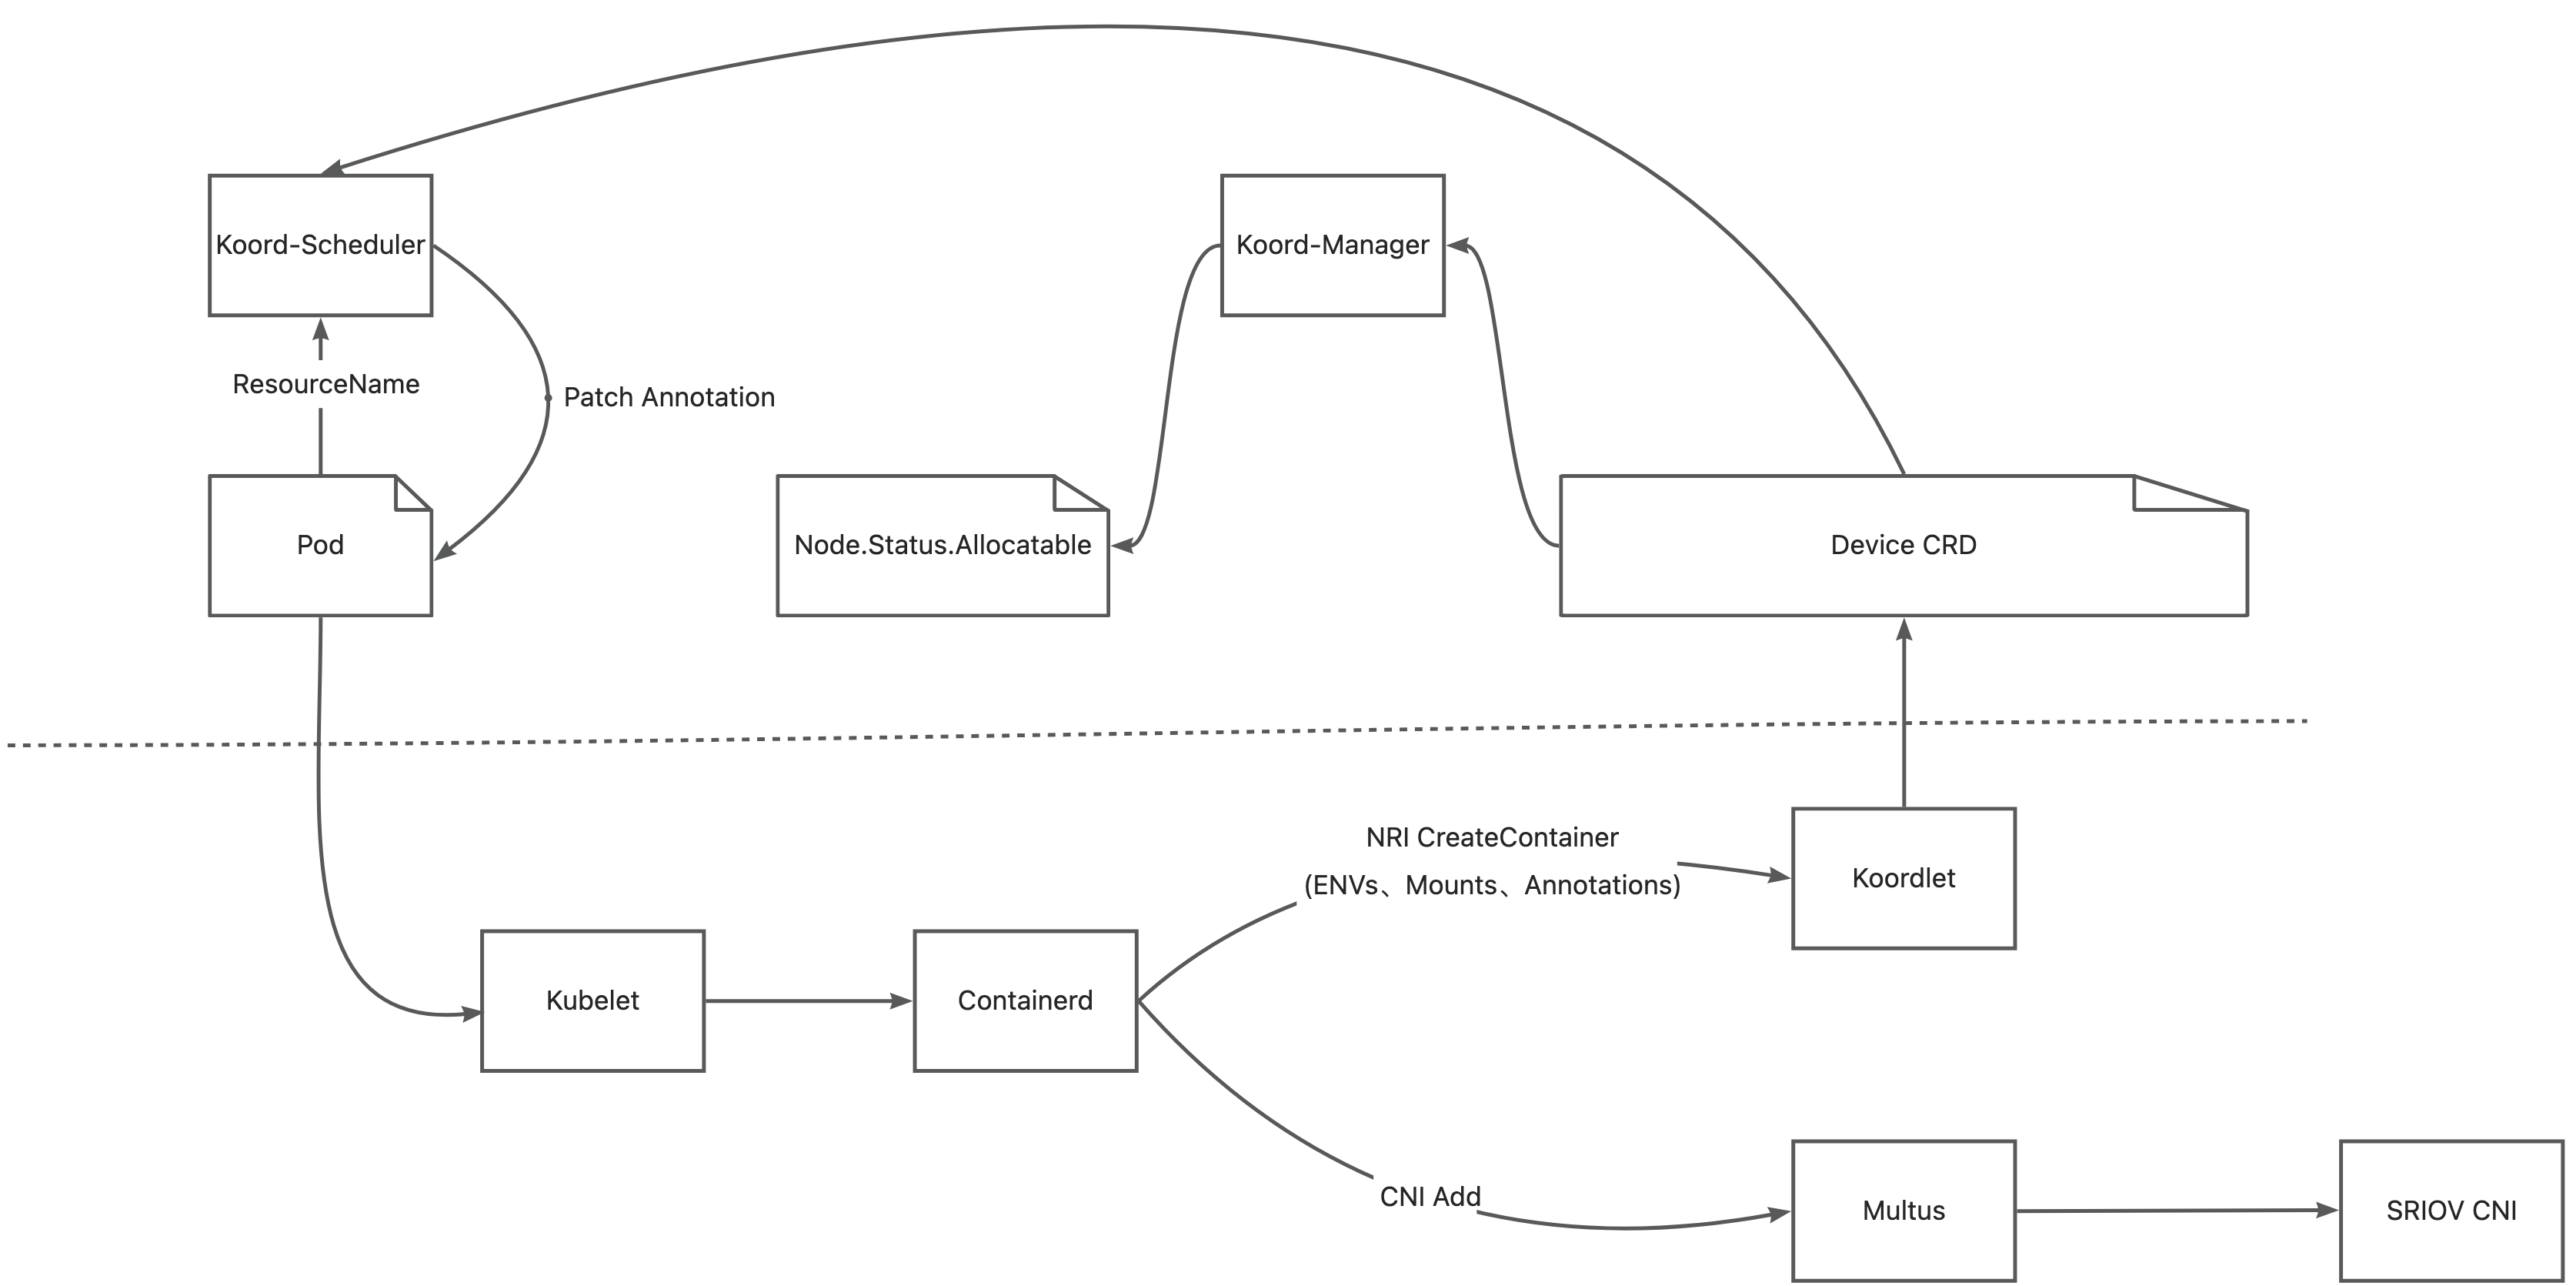
Koordlet detects the GPUs and RDMA-capable NICs in nodes and reports related information to the Device CR.
Koord-Manager syncs resources from the Device CR to node.status.allocatable.
Koord-Scheduler allocates GPUs and RDMA-capable NICs for pods according to device topology and annotates the pods with the allocation results.
Multus-CNI accesses the Koordlet PodResources Proxy to obtain the RDMA devices allocated to the pod and attaches the corresponding NICs to the pod's network namespace.
Koordlet provides NRI plugins that can mount devices into containers.
Due to the numerous components involved and the complexity of the environment, we provide this best practice guide. In this guide, we will demonstrate how to deploy Koordinator, Multus-CNI, and SRIOV-CNI step by step, as well as how to use NCCL programs to confirm that our system is indeed working.
The basic validation logic is as follows:
- the user will submit two Pods requesting GPU and RDMA resources, respectively.
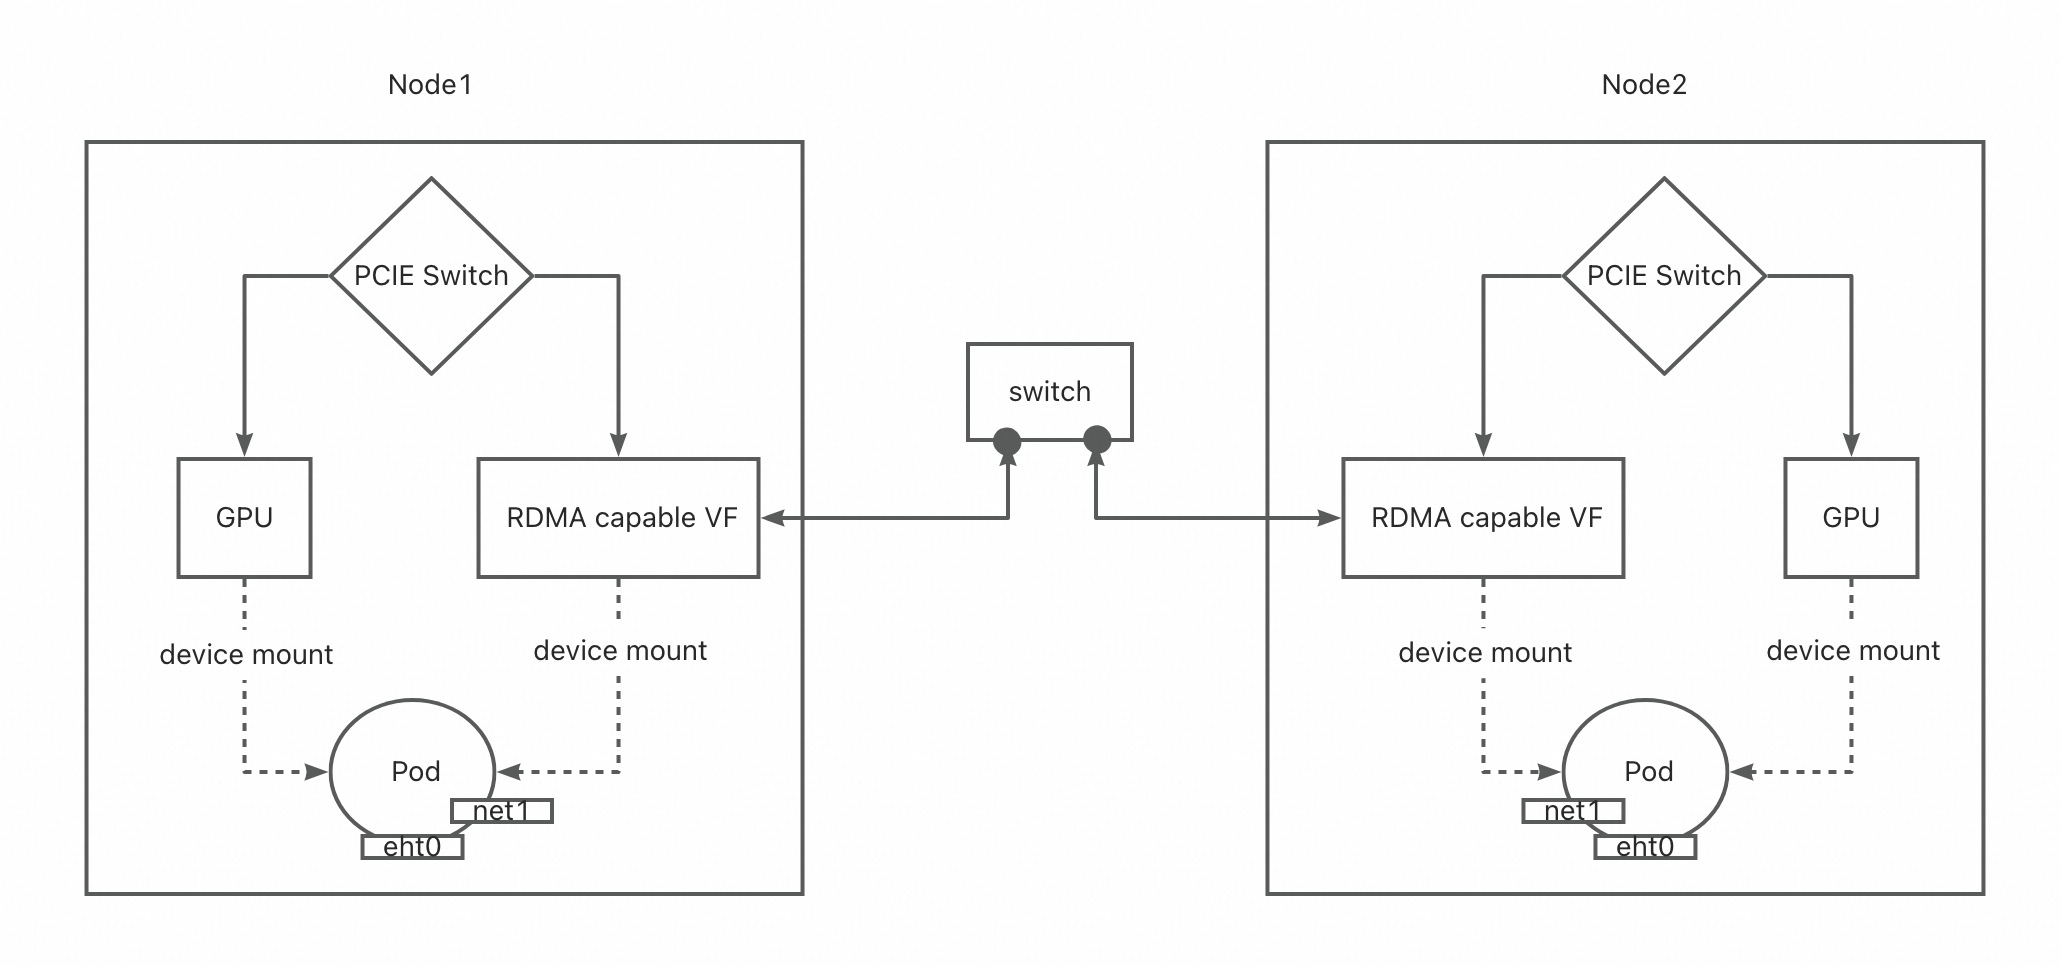
- Koordinator will allocate these two Pods to designated nodes, ensuring that the GPUs and RDMA assigned to the Pods are located under the same PCIe switch.
- We will then verify the RDMA connectivity between the Pods and ultimately use MPI to validate that GDR can run successfully.
Finally, from the data plane perspective, the device topology possessed by the Pods and the network association between the Pods appear as follows:
Prerequisite
- Kuberenetes >= 1.28
- Koordinator >= 1.6
- Containerd >= 1.7
- Multus-CNI >= 4.0
- SRIOV-CNI >= 2.0
Environment Setting
Cluster And Nodes
Our cluster has two worker nodes and one master node. The details version info is as follwoing table.
| Node Name | Kuberntes Version | IP | OS | Kernel | GPU | GPU Driver Version | Cuda | Containerd | nvidia-container-runtime | NIC | NIC Driver Version |
|---|---|---|---|---|---|---|---|---|---|---|---|
| k8s-master | v1.28.15 | 192.168.10.203 | Ubuntu 22.04.4 LTS | 6.8.0-45-generic | / | / | / | containerd://1.7.22 | / | / | / |
| k8s-node1 | v1.28.15 | 192.168.10.232 | Ubuntu 22.04.4 LTS | 6.8.0-45-generic | P40*4 | 550.127.05 | 12.4 | containerd://1.7.22 | 3.14.0-1 | Mellanox Technologies MT27800 Family [ConnectX-5] | MLNX_OFED_LINUX-24.07-0.6.1.0 |
| k8s-node2 | v1.28.15 | 192.168.10.231 | Ubuntu 22.04.4 LTS | 6.8.0-45-generic | P40*4 | 550.127.05 | 12.4 | containerd://1.7.22 | 3.14.0-1 | Mellanox Technologies MT27800 Family [ConnectX-5] | Driver version:MLNX_OFED_LINUX-24.07-0.6.1.0 |
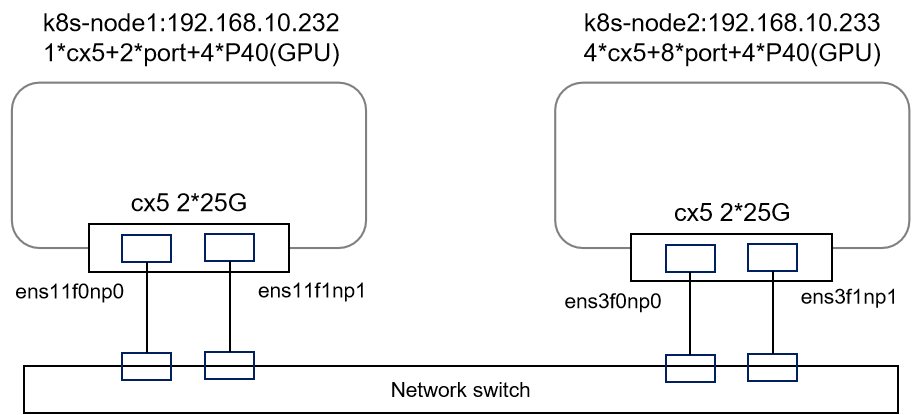
The device information and network connectivity information for the two worker nodes are pictured as follows:
Details about GPUs And NICs
Every worker has 4 Tesla P40 GPUs.
root@k8s-node1:~/ss/koo/script# nvidia-smi
Wed Nov 27 16:21:46 2024
+-----------------------------------------------------------------------------------------+
| NVIDIA-SMI 550.127.05             Driver Version: 550.127.05     CUDA Version: 12.4     |
|-----------------------------------------+------------------------+----------------------+
| GPU  Name                 Persistence-M | Bus-Id          Disp.A | Volatile Uncorr. ECC |
| Fan  Temp   Perf          Pwr:Usage/Cap |           Memory-Usage | GPU-Util  Compute M. |
|                                         |                        |               MIG M. |
|=========================================+========================+======================|
|   0  Tesla P40                      Off |   00000000:02:00.0 Off |                    0 |
| N/A   21C    P8             12W /  250W |       0MiB /  23040MiB |      0%      Default |
|                                         |                        |                  N/A |
+-----------------------------------------+------------------------+----------------------+
|   1  Tesla P40                      Off |   00000000:03:00.0 Off |                    0 |
| N/A   26C    P8             10W /  250W |       0MiB /  23040MiB |      0%      Default |
|                                         |                        |                  N/A |
+-----------------------------------------+------------------------+----------------------+
|   2  Tesla P40                      Off |   00000000:82:00.0 Off |                    0 |
| N/A   23C    P8             10W /  250W |       0MiB /  23040MiB |      0%      Default |
|                                         |                        |                  N/A |
+-----------------------------------------+------------------------+----------------------+
|   3  Tesla P40                      Off |   00000000:83:00.0 Off |                    0 |
| N/A   18C    P8              8W /  250W |       0MiB /  23040MiB |      0%      Default |
|                                         |                        |                  N/A |
+-----------------------------------------+------------------------+----------------------+

+-----------------------------------------------------------------------------------------+
| Processes:                                                                              |
|  GPU   GI   CI        PID   Type   Process name                              GPU Memory |
|        ID   ID                                                               Usage      |
|=========================================================================================|
|  No running processes found                                                             |
+-----------------------------------------------------------------------------------------+
root@k8s-node2:~# nvidia-smi
Wed Nov 27 16:22:16 2024
+-----------------------------------------------------------------------------------------+
| NVIDIA-SMI 550.120                Driver Version: 550.120        CUDA Version: 12.4     |
|-----------------------------------------+------------------------+----------------------+
| GPU  Name                 Persistence-M | Bus-Id          Disp.A | Volatile Uncorr. ECC |
| Fan  Temp   Perf          Pwr:Usage/Cap |           Memory-Usage | GPU-Util  Compute M. |
|                                         |                        |               MIG M. |
|=========================================+========================+======================|
|   0  Tesla P40                      Off |   00000000:02:00.0 Off |                    0 |
| N/A   31C    P8             10W /  250W |       0MiB /  23040MiB |      0%      Default |
|                                         |                        |                  N/A |
+-----------------------------------------+------------------------+----------------------+
|   1  Tesla P40                      Off |   00000000:03:00.0 Off |                    0 |
| N/A   31C    P8             10W /  250W |       0MiB /  23040MiB |      0%      Default |
|                                         |                        |                  N/A |
+-----------------------------------------+------------------------+----------------------+
|   2  Tesla P40                      Off |   00000000:82:00.0 Off |                    0 |
| N/A   37C    P8             10W /  250W |       0MiB /  23040MiB |      0%      Default |
|                                         |                        |                  N/A |
+-----------------------------------------+------------------------+----------------------+
|   3  Tesla P40                      Off |   00000000:83:00.0 Off |                    0 |
| N/A   30C    P8             10W /  250W |       0MiB /  23040MiB |      0%      Default |
|                                         |                        |                  N/A |
+-----------------------------------------+------------------------+----------------------+

+-----------------------------------------------------------------------------------------+
| Processes:                                                                              |
|  GPU   GI   CI        PID   Type   Process name                              GPU Memory |
|        ID   ID                                                               Usage      |
|=========================================================================================|
|  No running processes found                                                             |
+-----------------------------------------------------------------------------------------+
In addition to GPU, we also need to setup rdma environment on the worker nodes in advance.
Plan the physical NIC for the test
node name nic name Nic model NAD name Ip address remark K8s-node1 ens11f0np0
ens11f1np101:00.0 Ethernet controller [0200]: Mellanox Technologies MT27800 Family [ConnectX-5][15b3:1017]
01:00.1 Ethernet controller [0200]: Mellanox Technologies MT27800 Family [ConnectX-5][15b3:1017]sriov-attach-k8s-node1-ens11f0np0-kubeflow-conf 10.20.12.121 To simplify the testing, we create pod01 and have it schedule directionally to node1 and occupy the VF on node1 K8s-node2 ens3f0np0
ens3f1np181:00.0 Ethernet controller [0200]: Mellanox Technologies MT27800 Family [ConnectX-5][15b3:1017]
81:00.1 Ethernet controller [0200]: Mellanox Technologies MT27800 Family [ConnectX-5][15b3:1017]sriov-attach-k8s-node2-ens3f0np0-kubeflow-conf 10.20.12.134 To simplify the testing, we create pod02 and have it schedule directionally to node2 and occupy this VF Create a VF on node1
Log in to node1 and create VF based on the Mellanox CX5 network adapter. Since the host already has two nics, three cx5 nics will appear if VF is successfully created.
Create instruction is as follows:
echo '1' > /sys/class/net/ens11f0np0/device/sriov_numvfsThe host runs the following command: "lspci |grep Mell". If [ConnectX-5 Virtual Function] is displayed, VF is created successfully.
root@k8s-node1:/data/cc/code/koordinator# lspci |grep Mell
01:00.0 Ethernet controller: Mellanox Technologies MT27800 Family [ConnectX-5]
01:00.1 Ethernet controller: Mellanox Technologies MT27800 Family [ConnectX-5]
01:00.2 Ethernet controller: Mellanox Technologies MT27800 Family [ConnectX-5 Virtual Function] //VF
If you run ibstat, mlx5_2 in the output is VF:
CA 'mlx5_0'
        CA type: MT4119
        Number of ports: 1
        Firmware version: 16.35.4030
        Hardware version: 0
        Node GUID: 0x1070fd0300a4487a
        System image GUID: 0x1070fd0300a4487a
        Port 1:
                State: Active
                Physical state: LinkUp
                Rate: 25
                Base lid: 0
                LMC: 0
                SM lid: 0
                Capability mask: 0x00010000
                Port GUID: 0x1270fdfffea4487a
                Link layer: Ethernet
CA 'mlx5_1'
        CA type: MT4119
        Number of ports: 1
        Firmware version: 16.35.4030
        Hardware version: 0
        Node GUID: 0x1070fd0300a4487b
        System image GUID: 0x1070fd0300a4487a
        Port 1:
                State: Down
                Physical state: Disabled
                Rate: 25
                Base lid: 0
                LMC: 0
                SM lid: 0
                Capability mask: 0x00010000
                Port GUID: 0x1270fdfffea4487b
                Link layer: Ethernet
CA 'mlx5_2'      //VF
        CA type: MT4120
        Number of ports: 1
        Firmware version: 16.35.4030
        Hardware version: 0
        Node GUID: 0x0000000000000000
        System image GUID: 0x1070fd0300a4487a
        Port 1:
                State: Active
                Physical state: LinkUp
                Rate: 25
                Base lid: 0
                LMC: 0
                SM lid: 0
                Capability mask: 0x00010000
                Port GUID: 0x0000000000000000
                Link layer: Ethernet
Create a VF on node2
Log in to node2 and create VF based on the Mellanox CX5 network adapter. The host already has two cx5 nics. If the VF is created successfully, three cx5 nics are displayed.
Create instruction is as follows:
echo '1' > / sys/class/net/ens11f0np0 / device/sriov_numvfsThe host runs the following command: "lspci |grep Mell". If [ConnectX-5 Virtual Function] is displayed, VF is created successfully.
root@k8s-node3:~# lspci |grep Mell
d2:00.0 Ethernet controller: Mellanox Technologies MT27800 Family [ConnectX-5]
d2:00.1 Ethernet controller: Mellanox Technologies MT27800 Family [ConnectX-5]
d2:01.2 Ethernet controller: Mellanox Technologies MT27800 Family [ConnectX-5 Virtual Function]//VF
If you run ibstat, mlx5_2 in the output is VF
CA 'mlx5_0'
        CA type: MT4119
        Number of ports: 1
        Firmware version: 16.32.1010
        Hardware version: 0
        Node GUID: 0x1070fd0300a4486a
        System image GUID: 0x1070fd0300a4486a
        Port 1:
                State: Down
                Physical state: Disabled
                Rate: 40
                Base lid: 0
                LMC: 0
                SM lid: 0
                Capability mask: 0x00010000
                Port GUID: 0x0000000000000000
                Link layer: Ethernet
CA 'mlx5_1'
        CA type: MT4119
        Number of ports: 1
        Firmware version: 16.32.1010
        Hardware version: 0
        Node GUID: 0x1070fd0300a4486b
        System image GUID: 0x1070fd0300a4486a
        Port 1:
                State: Down
                Physical state: Disabled
                Rate: 25
                Base lid: 0
                LMC: 0
                SM lid: 0
                Capability mask: 0x00010000
                Port GUID: 0x0000000000000000
                Link layer: Ethernet
CA 'mlx5_2'               //VF
        CA type: MT4119
        Number of ports: 1
        Firmware version: 16.35.3006
        Hardware version: 0
        Node GUID: 0x1070fd0300a44882
        System image GUID: 0x1070fd0300a44882
        Port 1:
                State: Down
                Physical state: Disabled
                Rate: 40
                Base lid: 0
                LMC: 0
                SM lid: 0
                Capability mask: 0x00010000
                Port GUID: 0x0000000000000000
                Link layer: Ethernet
Deploy Koordinator, Multus-CNI and SRIOV-CNI
Deploy Koordinator
helm repo add koordinator-sh https://koordinator-sh.github.io/charts/
helm repo update
helm install koordinator koordinator-sh/koordinator --version 1.6.0
The modified yaml feature parameters of koordlet componet are as follows:
- -feature-gates=Accelerators=true,GPUEnvInject=true,RDMADeviceInject=true,RDMADevices=true,PodResourcesProxy=true
Deploy Multus
To use latest features try command below which applies a daemonset and installs thick Multus using kubectl:
kubectl apply -f https://raw.githubusercontent.com/k8snetworkplumbingwg/multus-cni/master/deployments/multus-daemonset-thick.ymlroot@k8s-master:~# kubectl get po -n kube-system |grep multus
kube-multus-ds-7ddbh 1/1 Running 0 38h
kube-multus-ds-cgvqq 1/1 Running 0 38h
kube-multus-ds-lc6nv 1/1 Running 0 38hThis indicates that your systems is ready to use Multus CNI. Supported from Multus-CNI release 4.0+.
Modify the daemonset to adapt to koordinator
kubectl edit ds kube-multus-ds -n kube-systemapiVersion: apps/v1
kind: DaemonSet
metadata:
name: kube-multus-ds
namespace: kube-system
labels:
tier: node
app: multus
name: multus
spec:
selector:
matchLabels:
name: multus
updateStrategy:
type: RollingUpdate
template:
metadata:
labels:
tier: node
app: multus
name: multus
spec:
containers:
- name: kube-multus
volumeMounts:
...
- name: host-var-lib-kubelet
mountPath: /var/lib/kubelet/pod-resources
mountPropagation: HostToContainer
...
volumes:
...
- name: host-var-lib-kubelet
hostPath:
path: /var/run/koordlet/pod-resources
...
Plan NAD for Nodes
Multus CNI relys on NetworkAttachmentDefinition configuration to allocate ip and configure network, we as cluster admin need to plan NAD configuration file in advance.
- the NAD of ens11f0np0 on node1 is as following:
apiVersion: "k8s.cni.cncf.io/v1"
kind: NetworkAttachmentDefinition
metadata:
  name: sriov-attach-k8s-node1-ens11f0np0-kubeflow-conf
  namespace: kubeflow
  annotations:
    k8s.v1.cni.cncf.io/resourceName: koordinator.sh/rdma
spec:
  config: '{
  "cniVersion": "0.3.1",
  "name": "sriov-attach",
  "type": "sriov",
  "capabilities": {
     "mac": true,
     "ipam": true
  },
  "master": "ens11f0np0",
  "mode": "passthrough",
  "ipam": {
    "type": "host-local",
    "subnet": "10.20.12.0/24",
    "rangeStart": "10.20.12.121", //Plan the IP address range of the Pod
    "rangeEnd": "10.20.12.121"
  }
}'
- the NAD of ens3f0np0 on node2 is as following:
  apiVersion: "k8s.cni.cncf.io/v1"
  kind: NetworkAttachmentDefinition
  metadata:
    name: sriov-attach-k8s-node2-ens3f0np0-kubeflow-conf
    namespace: kubeflow
    annotations:
      k8s.v1.cni.cncf.io/resourceName: koordinator.sh/rdma
  spec:
    config: '{
    "cniVersion": "0.3.1",
    "name": "sriov-attach",
    "type": "sriov",
    "capabilities": {
       "mac": true,
       "ipam": true
    },
    "master": "ens3f0np0",
    "mode": "passthrough",
    "ipam": {
      "type": "host-local",
      "subnet": "10.20.12.0/24",
      "rangeStart": "10.20.12.134",//Plan the IP address range of the Pod
      "rangeEnd": "10.20.12.134"
    }
  }'
create Namespace on k8s cluster
kubectl create ns kubeflowRun the following command to deploy the nad
kubectl apply -f sriov-attach-k8s-node1-ens11f0np0-kubeflow-conf.yaml
kubectl apply -f sriov-attach-k8s-node2-ens3f0np0-kubeflow-conf.yaml
Deploy SRIOV-CNI
See the SR-IOV CNI repository for build and installation instructions. Supported from SR-IOV CNI release 2.0+.
Deploy Pods and Check Allocation Result
Deploy Application Pods
Note: This experiment requires two pods, so you need to write yaml files corresponding to two Pods. Expect one Pod directed to node1 and one Pod directed to node2.
Label Nodes: In order to facilitate testing, Pod directional scheduling is required to a node, and Node needs to be labeled. Specific instructions are as follows
kubectl label nodes k8s-node1 koo=node1
kubectl label nodes k8s-node2 koo=node2
Deploy Pods: Run the following command to deploy the Pod
kubectl apply -f pod01.yaml
kubectl apply -f pod02.yamlapiVersion: v1
kind: Pod
metadata:
name: pod-vf01
namespace: kubeflow
annotations:
# this NAD is already written previously
k8s.v1.cni.cncf.io/networks: sriov-attach-k8s-node1-ens11f0np0-kubeflow-conf
scheduling.koordinator.sh/device-joint-allocate: |-
{
"deviceTypes": ["gpu","rdma"]
}
scheduling.koordinator.sh/device-allocate-hint: |-
{
"rdma": {
"vfSelector": {} //apply VF
}
}
labels:
selector-type: pod
spec:
nodeSelector:
koo: node1 //Directional scheduling to 1 node
schedulerName: koord-scheduler //Uses the koordlet scheduling plug-in
containers:
- name: container-vf
image: nvcr.io/nvidia/pytorch:24.04-py3
securityContext:
capabilities:
add: [ "IPC_LOCK" ]
imagePullPolicy: IfNotPresent
command: [ "/bin/bash", "-c", "--" ]
args: [ "while true; do sleep 300000; done;" ]
volumeMounts:
- mountPath: /dev/shm
name: shm
resources:
requests:
koordinator.sh/gpu: 100//apply a GPU
koordinator.sh/rdma: 100//apply a VF
limits:
koordinator.sh/gpu: 100
koordinator.sh/rdma: 100
volumes:
- name: shm
emptyDir:
medium: Memory
sizeLimit: "10Gi"apiVersion: v1
kind: Pod
metadata:
name: pod-vf02
namespace: kubeflow
annotations:
k8s.v1.cni.cncf.io/networks: sriov-attach-k8s-node3-enp210s0f1np1-kubeflow-conf
scheduling.koordinator.sh/device-joint-allocate: |-
{
"deviceTypes": ["gpu","rdma"]
}
scheduling.koordinator.sh/device-allocate-hint: |-
{
"rdma": {
"vfSelector": {}
}
}
labels:
selector-type: pod
spec:
nodeSelector:
koo: node2
schedulerName: koord-scheduler
containers:
- name: container-vf
image: nvcr.io/nvidia/pytorch:24.04-py3
securityContext:
capabilities:
add: [ "IPC_LOCK" ]
imagePullPolicy: IfNotPresent
command: [ "/bin/bash", "-c", "--" ]
args: [ "while true; do sleep 300000; done;" ]
volumeMounts:
- mountPath: /dev/shm
name: shm
resources:
requests:
koordinator.sh/gpu: 100
koordinator.sh/rdma: 100
limits:
koordinator.sh/gpu: 100
koordinator.sh/rdma: 100
volumes:
- name: shm
emptyDir:
medium: Memory
sizeLimit: "10Gi"Check pod running status
root@k8s-master:~/ss/koo/rdma/sriov# kubectl get po -n kubeflow -owide
NAME       READY   STATUS    RESTARTS   AGE    IP            NODE        NOMINATED NODE   READINESS GATES
pod-vf01   1/1     Running   0          103m   10.244.1.10   k8s-node1   <none>           <none>
pod-vf02   1/1     Running   0          10h    10.244.2.18   k8s-node2   <none>           <none>
If the status of the pod is running, the pod is successfully created and running.
Check Device Allocation Result
We extract the allocation information of pod-vf01 through the following command
kubectl get pod pod-vf01 -n kubeflow -oyamlscheduling.koordinator.sh/device-allocated: '{"gpu":[{"minor":0,"resources":{"koordinator.sh/gpu-core":"100","koordinator.sh/gpu-memory":"23040Mi","koordinator.sh/gpu-memory-ratio":"100"}}],"rdma":[{"minor":0,"resources":{"koordinator.sh/rdma":"1"},"extension":{"vfs":[{"minor":-1,"busID":"0000:01:00.2"}]}}]}'
......
dnsPolicy: ClusterFirst
enableServiceLinks: true
nodeName: k8s-node1 //It has been scheduled to node 1
nodeSelector:
koo: node1
preemptionPolicy: PreemptLowerPriority
priority: 0
restartPolicy: Always
schedulerName: koord-schedulerEnter the container and run the command "nvidia-smi" and Check the GPU allocation result
root@pod-vf01:/home# nvidia-smi
Fri Nov 22 06:55:59 2024
+-----------------------------------------------------------------------------------------+
| NVIDIA-SMI 550.127.05             Driver Version: 550.127.05     CUDA Version: 12.4     |
|-----------------------------------------+------------------------+----------------------+
| GPU  Name                 Persistence-M | Bus-Id          Disp.A | Volatile Uncorr. ECC |
| Fan  Temp   Perf          Pwr:Usage/Cap |           Memory-Usage | GPU-Util  Compute M. |
|                                         |                        |               MIG M. |
|=========================================+========================+======================|
|   0  Tesla P40                      Off |   00000000:02:00.0 Off |                    0 |
| N/A   24C    P8             10W /  250W |       0MiB /  23040MiB |      0%      Default |
|                                         |                        |                  N/A |
+-----------------------------------------+------------------------+----------------------+

+-----------------------------------------------------------------------------------------+
| Processes:                                                                              |
|  GPU   GI   CI        PID   Type   Process name                              GPU Memory |
|        ID   ID                                                               Usage      |
|=========================================================================================|
|  No running processes found                                                             |
+-----------------------------------------------------------------------------------------+
Check whether the Pod named pod-vf01 device assignment results meet affinity
kubectl get devices.scheduling.koordinator.sh k8s-node1 -oyamlapiVersion: scheduling.koordinator.sh/v1alpha1
kind: Device
metadata:
.....
spec:
devices:
- health: true
id: GPU-989aa251-1dfe-5bbc-7c12-46e817b1de9a
minor: 0 //The GPU to which pod-vf01 is assigned is GPU 0, and the corresponding PCIE is pci0000:00
resources:
koordinator.sh/gpu-core: "100"
koordinator.sh/gpu-memory: 23040Mi
koordinator.sh/gpu-memory-ratio: "100"
topology:
busID: "0000:02:00.0"
nodeID: 0
pcieID: pci0000:00
socketID: -1
type: gpu
- health: true
id: "0000:01:00.0"
minor: 0
resources:
koordinator.sh/rdma: "100"
topology:
busID: "0000:01:00.0"
nodeID: 0
pcieID: pci0000:00
socketID: -1
type: rdma
vfGroups:
- vfs:
- busID: "0000:01:00.2"//pod-vf01 is assigned to this vf device, and the corresponding PCIE is pci0000:00
minor: -1
- health: true
id: GPU-e8a40bd0-e484-2d1b-cad9-75b043139b0c
minor: 1
resources:
koordinator.sh/gpu-core: "100"
koordinator.sh/gpu-memory: 23040Mi
koordinator.sh/gpu-memory-ratio: "100"
topology:
busID: "0000:03:00.0"
nodeID: 0
pcieID: pci0000:00
socketID: -1
type: gpu
- health: true
id: "0000:01:00.1"
minor: 1
resources:
koordinator.sh/rdma: "100"
topology:
busID: "0000:01:00.1"
nodeID: 0
pcieID: pci0000:00
socketID: -1
type: rdma
- health: true
id: GPU-5293b3a7-2bbb-e135-c6ab-c548b5c5b0a6
minor: 2
resources:
koordinator.sh/gpu-core: "100"
koordinator.sh/gpu-memory: 23040Mi
koordinator.sh/gpu-memory-ratio: "100"
topology:
busID: 0000:82:00.0
nodeID: 0
pcieID: pci0000:80
socketID: -1
type: gpu
- health: true
id: "0000:05:00.0"
minor: 2
resources:
koordinator.sh/rdma: "100"
topology:
busID: "0000:05:00.0"
nodeID: 0
pcieID: pci0000:00
socketID: -1
type: rdma
- health: true
id: GPU-d60a283a-a846-eaa7-f551-c0c4f6f4402a
minor: 3
resources:
koordinator.sh/gpu-core: "100"
koordinator.sh/gpu-memory: 23040Mi
koordinator.sh/gpu-memory-ratio: "100"
topology:
busID: 0000:83:00.0
nodeID: 0
pcieID: pci0000:80
socketID: -1
type: gpu
status: {}According to the topology information, pod-vf01 is assigned to the vf device busID: "0000:01:00.2", and the corresponding PCIE is pci0000:00. The GPU to which pod-vf01 is assigned is GPU 0, and the corresponding PCIE is pci0000:00. Because PCIE is the same, the GPU and NIC meet the expected topology affinity.
In the same way, check whether the device assignment result of pod-vf02 meets affinity
At this point, one GPU and one RDMA device applied by the two Pods are successfully allocated, and the topology affinity is met.
Check RDMA Connectivity
Check Network Connectivity
Enter the pod and install basic network tools
kubectl exec -it pod-vf01 -n kubeflow -- bashapt-get update
apt-get install -y net-tools
apt install -y iputils-ping
apt-get install infiniband-diags -y
apt-get install -y kmod
apt-get install -y perftest
apt-get install -y ethtool
......Check the IP address assignment.
eth0: flags=4163<UP,BROADCAST,RUNNING,MULTICAST>  mtu 1450
        inet 10.244.1.10  netmask 255.255.255.0  broadcast 10.244.1.255
        inet6 fe80::e4c7:a3ff:fe4c:9d15  prefixlen 64  scopeid 0x20<link>
        ether e6:c7:a3:4c:9d:15  txqueuelen 0  (Ethernet)
        RX packets 17129  bytes 57434980 (57.4 MB)
        RX errors 0  dropped 244  overruns 0  frame 0
        TX packets 13383  bytes 1019323 (1.0 MB)
        TX errors 0  dropped 0 overruns 0  carrier 0  collisions 0

lo: flags=73<UP,LOOPBACK,RUNNING>  mtu 65536
        inet 127.0.0.1  netmask 255.0.0.0
        inet6 ::1  prefixlen 128  scopeid 0x10<host>
        loop  txqueuelen 1000  (Local Loopback)
        RX packets 487  bytes 211446 (211.4 KB)
        RX errors 0  dropped 0  overruns 0  frame 0
        TX packets 487  bytes 211446 (211.4 KB)
        TX errors 0  dropped 0 overruns 0  carrier 0  collisions 0

net1: flags=4163<UP,BROADCAST,RUNNING,MULTICAST>  mtu 1500
        inet 10.20.12.121  netmask 255.255.255.0  broadcast 10.20.12.255
        inet6 fe80::6ce7:bfff:fee0:9382  prefixlen 64  scopeid 0x20<link>
        ether 6e:e7:bf:e0:93:82  txqueuelen 1000  (Ethernet)
        RX packets 477  bytes 86270 (86.2 KB)
        RX errors 0  dropped 0  overruns 0  frame 0
        TX packets 327  bytes 47335 (47.3 KB)
        TX errors 0  dropped 0 overruns 0  carrier 0  collisions 0
The net1 network port name here is the network port name assigned by multus-cni to pod, and the address is the address segment we configured in the previous nad named sriov-attach-k8s-node1-ens11f0np0-kubeflow-conf: 10.20.12.121.
Same as pod-vf01, the IP address of pod-vf02 is as following:
eth0: flags=4163<UP,BROADCAST,RUNNING,MULTICAST>  mtu 1450
        inet 10.244.2.21  netmask 255.255.255.0  broadcast 10.244.2.255
        inet6 fe80::f45c:90ff:fe3a:67a2  prefixlen 64  scopeid 0x20<link>
        ether f6:5c:90:3a:67:a2  txqueuelen 0  (Ethernet)
        RX packets 21690  bytes 65555332 (65.5 MB)
        RX errors 0  dropped 1310  overruns 0  frame 0
        TX packets 15612  bytes 1218973 (1.2 MB)
        TX errors 0  dropped 0 overruns 0  carrier 0  collisions 0

lo: flags=73<UP,LOOPBACK,RUNNING>  mtu 65536
        inet 127.0.0.1  netmask 255.0.0.0
        inet6 ::1  prefixlen 128  scopeid 0x10<host>
        loop  txqueuelen 1000  (Local Loopback)
        RX packets 794  bytes 277124 (277.1 KB)
        RX errors 0  dropped 0  overruns 0  frame 0
        TX packets 794  bytes 277124 (277.1 KB)
        TX errors 0  dropped 0 overruns 0  carrier 0  collisions 0

net1: flags=4163<UP,BROADCAST,RUNNING,MULTICAST>  mtu 1500
        inet 10.20.12.134  netmask 255.255.255.0  broadcast 10.20.12.255
        inet6 fe80::ac97:a4ff:fe72:d1f1  prefixlen 64  scopeid 0x20<link>
        ether ae:97:a4:72:d1:f1  txqueuelen 1000  (Ethernet)
        RX packets 492  bytes 110501 (110.5 KB)
        RX errors 0  dropped 0  overruns 0  frame 0
        TX packets 318  bytes 42371 (42.3 KB)
        TX errors 0  dropped 0 overruns 0  carrier 0  collisions 0
The net1 network port name here is the network port name assigned by multus-cni to pod, and the address is the address segment we configured in the previous nad named sriov-attach-k8s-node2-ens3f0np0-kubeflow-conf: 10.20.12.134.
Ping pod-vf02's net1 network port inside pod-vf01:
root@pod-vf01:/workspace# ping 10.20.12.134
PING 10.20.12.134 (10.20.12.134) 56(84) bytes of data.
64 bytes from 10.20.12.134: icmp_seq=1 ttl=64 time=0.293 ms
64 bytes from 10.20.12.134: icmp_seq=2 ttl=64 time=0.212 ms
64 bytes from 10.20.12.134: icmp_seq=3 ttl=64 time=0.216 ms
64 bytes from 10.20.12.134: icmp_seq=4 ttl=64 time=0.221 ms
The results show that the two Pods can communicate with each other, but ping is not enough to prove that the VF ports assigned by the two cx5 can communicate. You need to perform further tests on the specified vf port.
Check RDMA Connectivity
Check the mounting information of vf devices inside the pod, using POD-VF01 as an example (pod-vf02 refer to pod-vf01 for the same reason, no special explanation is provided here).
root@pod-vf01:/workspace# ibstat
CA 'mlx5_0'
        CA type: MT4119
        Number of ports: 1
        Firmware version: 16.35.4030
        Hardware version: 0
        Node GUID: 0x1070fd0300a4487a
        System image GUID: 0x1070fd0300a4487a
        Port 1:
                State: Active
                Physical state: LinkUp
                Rate: 25
                Base lid: 0
                LMC: 0
                SM lid: 0
                Capability mask: 0x00010000
                Port GUID: 0x0000000000000000
                Link layer: Ethernet
CA 'mlx5_1'
        CA type: MT4119
        Number of ports: 1
        Firmware version: 16.35.4030
        Hardware version: 0
        Node GUID: 0x1070fd0300a4487b
        System image GUID: 0x1070fd0300a4487a
        Port 1:
                State: Down
                Physical state: Disabled
                Rate: 25
                Base lid: 0
                LMC: 0
                SM lid: 0
                Capability mask: 0x00010000
                Port GUID: 0x0000000000000000
                Link layer: Ethernet
CA 'mlx5_2'//VF
        CA type: MT4120
        Number of ports: 1
        Firmware version: 16.35.4030
        Hardware version: 0
        Node GUID: 0x0000000000000000
        System image GUID: 0x1070fd0300a4487a
        Port 1:
                State: Active
                Physical state: LinkUp
                Rate: 25
                Base lid: 0
                LMC: 0
                SM lid: 0
                Capability mask: 0x00010000
                Port GUID: 0x6ce7bffffee09382
                Link layer: Ethernet
You can see three network ports: mlx5_0 (Up), mlx5_1 (Down), and mlx5_2 (Up). In fact, the VF we apply for comes from the mlx5_2 virtualized by the physical network adapter mlx5_0. That is, mlx5_2 is a virtual network interface, which is derived from mlx5_0. mlx5_1 is unavailable in the Down state. The pod should actually only use the mlx5_2 virtual VF communication inside. Similarly, the VF port used by pod-vf02 is mlx5_2. So let's do a test.
Enter the Pod-vf01 container, use the mlx5_2 (VF) port to enable the ib_write listening service.
root@pod-vf01:/workspace# ib_write_bw -d mlx5_2 -F

************************************
Waiting for client to connect... *
************************************
Enter the Pod-vf02 container, use the mlx5_2 (VF) port to enable the ib_write service connected to pod-vf01, and run the following command
root@pod-vf02:/workspace# ib_write_bw -d mlx5_2 10.20.12.121
---------------------------------------------------------------------------------------
                    RDMA_Write BW Test
 Dual-port       : OFF          Device         : mlx5_2
 Number of qps   : 1            Transport type : IB
 Connection type : RC           Using SRQ      : OFF
 PCIe relax order: ON
 ibv_wr* API     : ON
 TX depth        : 128
 CQ Moderation   : 1
 Mtu             : 1024[B]
 Link type       : Ethernet
 GID index       : 3
 Max inline data : 0[B]
 rdma_cm QPs     : OFF
 Data ex. method : Ethernet
---------------------------------------------------------------------------------------
 local address: LID 0000 QPN 0x03ad PSN 0x17d925 RKey 0x029300 VAddr 0x0073f17a0af000
 GID: 00:00:00:00:00:00:00:00:00:00:255:255:10:20:12:134
 remote address: LID 0000 QPN 0x00e1 PSN 0x146e34 RKey 0x021400 VAddr 0x007bc5c59c3000
 GID: 00:00:00:00:00:00:00:00:00:00:255:255:10:20:12:121
---------------------------------------------------------------------------------------
 #bytes     #iterations    BW peak[MB/sec]    BW average[MB/sec]   MsgRate[Mpps]
Conflicting CPU frequency values detected: 800.000000 != 2000.000000. CPU Frequency is not max.
 65536      5000             2758.40            2758.38            0.044134
---------------------------------------------------------------------------------------
bytes: The size of data transmitted each time is 65536 bytes.
iterations: 5000 iterations are performed.
BW peak[MB/sec] : The peak bandwidth is 2758.40 MB/s.
BW average[MB/sec] : The average bandwidth is 2758.38 MB/s.
MsgRate[Mpps] : The message rate (messages per second) is 0.044134 Mpps.In the preceding result, ibv_wr API:ON indicates that ibv_wr API is used to perform RDMA operations. Transport type: IB: indicates InfiniBand. Note: The IB nic device of the RDMA protocol is used for network communication, which meets expectations.
Next, we test GPU communication, that is, we used GPU collection communication library NCCL to carry out NCCL communication test on VF network ports of two cx5.
Check GPUDirect RDMA
Install the NCCL Library and Compile
Enter pod-vf01 and pod-vf02 respectively, and install nccl and compile, taking pod-vf01 as an example:
Enter pod-vf01
kc exec -it pod-vf07 -n kubeflow -- bashEnter directory /home
cd /home/Download code
git clone https://github.com/NVIDIA/nccl-tests.gitEnter directory /home/nccl-tests
cd /home/nccl-testsCompile
make MPI=1 MPI_HOME=/usr/local/mpi
Setup Mutual Trust between Pods
Install openssh
Enter into pod-vf01
kc exec -it pod-vf01 -n kubeflow -- bashapt-update
apt updateinstall openssh-server
apt install vim openssh-server openssh-client -yRepeat the above steps on pod-vf02
Generate RSA Key
Write the contents of the file /root/.ssh/id_rsa.pub to /root/.ssh/authorized_keys in all containers: Copy by hand, one per line
ssh-rsa AAAAB3NzaC1yc2EAAAADAQABAAABgQCVRX69XvcjVlF6a1wqxMMh4ZHDNSzEGwPm7qJdsCkO1JPUpCI+2h44NzRtKBFMf1kfw3d6fOqTh/mVhuhBFTmsQVHaGjj8tffkVzieSJ3RAQYFHKvv4ZPvcN3bsbiqbjE9Syq0JLDahZy1sfTygI0ax6p0uJVAVr03bKy31WVAVi2R6f2Hc6QB5tsHVOzIBK7hCehhNe0wfPW8q0vVK8y36DBLwZC92DLPn77x27c8zT87K2nIuDiVGGkKAu3Fkk6utYswPijlZIW6OjMY1Orx8400eo77wZSybCfZJc25Fr9C14l53db7BV4x1vOcy1teGh8OkOJXwtDo6okQpOJhpuG25FlIpFEgQJZPFkYHOFB+q783+o8vAFd7g3xouS2ARlNnqsO7jB8ZvMTaa89NyKlQKWI3ObVkqjqYvRXlZ/gDhRG2Z5QSV/eVhsY3Dx5IMVPobz4R3rV3/n5QIUXRnMebEAxdfM+VeX+0P11yjPOrYyti7D+p1rYB+3Yf5/0=
ssh-rsa AAAAB3NzaC1yc2EAAAADAQABAAABgQCZRkemmpzBFIl8CQ3lb8uzzMs5H9f7Mo8eHm/IVYRR8FF6X1Gh+z8c88q1fdMgfa9vup2JbRywUeHS2LY9+I3Ln2MK6VB568LjRGJFaGK2vrEcBnaQgPKa9W1xXX+k+93CcAgjECw92nVVKCkfALLUyZEEqmw9Va5iV74cPM7le7VBQOfbOWfogweYuwE7FwRHrFDbueyc9GX1BvzOscSFn/V2YEuQzKOkZQHmcX+OAeV/TepZVKzYzt5mN0Q0P7UWmgn2CD+a4IFjQjXxbPw1zDP+wYmD6jIADks2GNHJu8huCK4IMJQzesMOWoch+2kkK80b0UvAQjTUMwMr2t6CPgOQafEygOr623clROYSSycTQ09ikt9g6SO31UZ4idNcoRcYqomDUs3+pceorer9adLHXM8MmRyRl6wEhCufJ4p4hYhwkL0rLCpBQ011NCP0hzoxUlQyVMnW13ztaKazX65ibunelGdpxJVeI++ldHDD6I3ZdhyP9Yiw767ka2k=
To generate a rsa key, run the ssh-keygen -t rsa command and press Enter
ssh-keygen -t rsa
Start sshd
Execute the following commands inside each pod.
mkdir -p /var/run/sshd && /usr/sbin/sshd -p 20024
Verify SSH Connectivity
Note The ip address of Pod-vf02 is 10.244.2.21. To access pod-vf01, run ssh root@10.244.2.21 -p 20024
root@pod-vf01:/home# ssh root@10.244.2.21 -p 20024
Welcome to Ubuntu 22.04.4 LTS (GNU/Linux 6.5.0-41-generic x86_64)

 * Documentation:  https://help.ubuntu.com
 * Management:     https://landscape.canonical.com
 * Support:        https://ubuntu.com/pro

This system has been minimized by removing packages and content that are
not required on a system that users do not log into.

To restore this content, you can run the 'unminimize' command.
Last login: Fri Nov 22 06:51:03 2024 from 10.244.2.1
root@pod-vf02:~#
If it is displayed that you can directly jump to the inside of another pod-vf02 container, it means that the no-secret setting is successful!
Double Machine IB Communication
We use the following command to perform GPU communication by RDMA between two Pods on different nodes.
mpirun --allow-run-as-root -H 10.244.1.10:1,10.244.2.21:1 -mca plm_rsh_args "-p 20024" -x NCCL_IB_DISABLE=0 -x NCCL_DEBUG=INFO -x NCCL_SOCKET_IFNAME=eth0 -x NCCL_IB_HCA==mlx5_2 -x UCX_NET_DEVICES=eth0 -x NCCL_NET_GDR_READ=1 ./build/all_reduce_perf -b 2M -e 2G -f 2 -g 1 -n 100 -w 5

# -x NCCL_IB_HCA==mlx5_2: the name of the VF NIC device;
# -H 10.244.1.10:1,10.244.2.21:1  the IP addresses of the two containers, where :1 indicates the number of GPUs.
Inside either container, the personal test executes the following command inside the pod-vf02 container:
root@pod-vf02:/home/nccl-tests# mpirun --allow-run-as-root -H 10.244.1.10:1,10.244.2.21:1 -mca plm_rsh_args "-p 20024" -x NCCL_IB_DISABLE=0 -x NCCL_DEBUG=INFO -x NCCL_SOCKET_IFNAME=eth0 -x NCCL_IB_HCA==mlx5_2 -x UCX_NET_DEVICES=eth0 -x NCCL_NET_GDR_READ=1 ./build/all_reduce_perf -b 2M -e 2G -f 2 -g 1 -n 100 -w 5
# nThread 1 nGpus 1 minBytes 2097152 maxBytes 2147483648 step: 2(factor) warmup iters: 5 iters: 100 agg iters: 1 validation: 1 graph: 0
...............
NCCL version 2.21.5+cuda12.4
pod-vf07:15718:15718 [0] NCCL INFO cudaDriverVersion 12040
pod-vf07:15718:15718 [0] NCCL INFO NCCL_SOCKET_IFNAME set by environment to eth0
pod-vf07:15718:15718 [0] NCCL INFO Bootstrap : Using eth0:10.244.1.10<0>
pod-vf08:12090:12099 [0] NCCL INFO Plugin Path : /opt/hpcx/nccl_rdma_sharp_plugin/lib/libnccl-net.so
pod-vf08:12090:12099 [0] NCCL INFO P2P plugin IBext_v8
pod-vf08:12090:12099 [0] NCCL INFO NCCL_SOCKET_IFNAME set by environment to eth0
pod-vf08:12090:12099 [0] NCCL INFO NET/IB : Using [0]mlx5_2:1/RoCE [RO]; OOB eth0:10.244.2.21<0>
pod-vf08:12090:12099 [0] NCCL INFO Using non-device net plugin version 0
pod-vf08:12090:12099 [0] NCCL INFO Using network IBext_v8
pod-vf07:15718:15726 [0] NCCL INFO Plugin Path : /opt/hpcx/nccl_rdma_sharp_plugin/lib/libnccl-net.so
pod-vf07:15718:15726 [0] NCCL INFO P2P plugin IBext_v8
pod-vf07:15718:15726 [0] NCCL INFO NCCL_SOCKET_IFNAME set by environment to eth0
pod-vf07:15718:15726 [0] NCCL INFO NET/IB : Using [0]mlx5_2:1/RoCE [RO]; OOB eth0:10.244.1.10<0>
pod-vf07:15718:15726 [0] NCCL INFO Using non-device net plugin version 0
pod-vf07:15718:15726 [0] NCCL INFO Using network IBext_v8
..............

pod-vf02:12090:12099 [0] NCCL INFO ncclCommInitRank comm 0x5e303a52bd70 rank 0 nranks 2 cudaDev 0 nvmlDev 0 busId 57000 commId 0xadcb40d61cc1bc4b - Init COMPLETE
#
#                                                              out-of-place                       in-place
#       size         count      type   redop    root     time   algbw   busbw #wrong     time   algbw   busbw #wrong
#        (B)    (elements)                               (us)  (GB/s)  (GB/s)            (us)  (GB/s)  (GB/s)
     2097152        524288     float     sum      -1    880.2    2.38    2.38      0    877.1    2.39    2.39      0
     4194304       1048576     float     sum      -1   1735.3    2.42    2.42      0   1737.9    2.41    2.41      0
     8388608       2097152     float     sum      -1   3444.5    2.44    2.44      0   3440.1    2.44    2.44      0
    16777216       4194304     float     sum      -1   6828.2    2.46    2.46      0   6857.6    2.45    2.45      0
    33554432       8388608     float     sum      -1    13405    2.50    2.50      0    13311    2.52    2.52      0
    67108864      16777216     float     sum      -1    25563    2.63    2.63      0    25467    2.64    2.64      0
   134217728      33554432     float     sum      -1    49333    2.72    2.72      0    49034    2.74    2.74      0
   268435456      67108864     float     sum      -1    96904    2.77    2.77      0    96606    2.78    2.78      0
   536870912     134217728     float     sum      -1   190709    2.82    2.82      0   190911    2.81    2.81      0
  1073741824     268435456     float     sum      -1   379615    2.83    2.83      0   380115    2.82    2.82      0
  2147483648     536870912     float     sum      -1   756857    2.84    2.84      0   757311    2.84    2.84      0
pod-vf01:15718:15718 [0] NCCL INFO comm 0x576eb5d4d740 rank 1 nranks 2 cudaDev 0 busId 2000 - Destroy COMPLETE
pod-vf02:12090:12090 [0] NCCL INFO comm 0x5e303a52bd70 rank 0 nranks 2 cudaDev 0 busId 57000 - Destroy COMPLETE
# Out of bounds values : 0 OK
# Avg bus bandwidth    : 2.61937
The above test results show that nccl runs successfully, and the GPU communication between containers uses mlx5_2 communication device.
The preceding nccl logs show that the IB device mlx5_2 is used.
pod-vf02:12090:12099 [0] NCCL INFO NET/IB : Using [0]mlx5_2:1/RoCE [RO]; OOB eth0:10.244.2.21<0>
pod-vf01:15718:15726 [0] NCCL INFO NET/IB : Using [0]mlx5_2:1/RoCE [RO]; OOB eth0:10.244.1.10<0>
Thus, it is proven that the scheduling framework Koordinator can jointly schedule GPU and RDMA devices, RDMA devices are successfully mounted to the container, and GPU and RDMA maintain topological affinity, which can greatly improve the communication efficiency of GPUs and subsequently enhance the training efficiency of large models.