Performance Collector
背景
在真实的生产环境下,单机的运行时状态是一个“混沌系统”,资源竞争产生的应用干扰无法绝对避免。Koordinator正在建立干扰检测与优化的能力,通过提取应用运行状态的指标,进行实时的分析和检测,在发现干扰后对目标应用和干扰源采取更具针对性的策略。
Koordinator已经实现了一系列Performance Collector,在单机侧采集与应用运行状态高相关性的底层指标,并通过Prometheus暴露出来,为干扰检测能力和集群应用调度提供支持。
使用方法
准备条件
Kubernetes >= 1.18
Koordinator >= 1.0
若您使用CPI Collector,请确保您的机器支持获取Cycles、Instructions这两个Kernel PMU(Performance Monitoring Unit)事件。
使用如下命令检查是否支持
$ perf list
List of pre-defined events (to be used in -e):

  branch-instructions OR branches                    [Hardware event]
  branch-misses                                      [Hardware event]
  bus-cycles                                         [Hardware event]
  ...

  cpu-cycles OR cpu/cpu-cycles/                      [Kernel PMU event]
  ...
  instructions OR cpu/instructions/                  [Kernel PMU event]
若您使用PSI Collector,您需要在Anolis OS中开启PSI功能,您可以参考文档获取开启方法。
安装
请确保Koordinator的相关组件已被正确安装于您的集群中。您可以参考文档Installation来获取相关的安装方法。
feature-gates
Performance Collector由多个feature-gate进行控制,Koordinator目前提供一下几个指标采集器:
CPICollector:用于控制CPI指标采集器。CPI:Cycles Per Instruction。PSICollector:用于控制PSI指标采集器。PSI:Pressure Stall Information。
配置
Performance Collector目前是默认关闭的。您可以通过修改Koordlet的feature-gates项来使用它,此项修改不会影响其他feature-gate
kubectl edit ds koordlet -n koordinator-system
...
spec:
  ...
    spec:
      containers:
      - args:
        ...
        # modify here
        # - -feature-gates=BECPUEvict=true,BEMemoryEvict=true,CgroupReconcile=true,Accelerators=true
        - -feature-gates=BECPUEvict=true,BEMemoryEvict=true,CgroupReconcile=true,Accelerators=true,CPICollector=true,PSICollector=true
        ...
开销对比
Koordinator Performance Collector作为干扰检测的重要工具,其核心目标之一为在低成本、无自身干扰引入的情况下采集相关指标。下文展示了开启Performance Collector前后Koordinator引入的系统开销。用户可参考此测试结果使用Performance Collector功能。
测试环境
- 阿里云容器服务Kubernetes版(ACK)托管版集群:
- Kubernetes版本:1.24.6-aliyun.1
- 容器运行时:containerd 1.5.13
- 节点规格:ecs.ebmg6.26xlarge,104 vCPU 384 GiB,操作系统Alibaba Cloud Linux 2.1903
- 节点负载:
- 测试Pod镜像:nginx:1.14.2
- 单节点Pod数量:100 test Pod + 50 system Pod
- 单节点容器数量:150
- 系统CPU usage水位:25%左右,使用lookbusy-1.4工具在每个CPU核上生产压力
- 其他条件:
- 100个nginx Pod由Linux cronjob管理,每五分钟删除一次。Deployment控制器将会随之进行重建。
- CPI Collector的运行时间窗口为每60秒一次,每次持续时长10秒。
- PSI Collector每10秒采集一次。
- 测试在Performance Collector开启前后均运行一小时。
测试结论
Case 1:Koordlet容器运行Performance Collector前后开销对比
Performance Collector运行于Koordinator的Koordlet组件,现将其对该组件的开销对比如下:
总体开销无明显上升:
关键指标 开启前 开启后 RSS Memory usage 341MiB 366MiB CPU usage 0.5 core 0.6 core 网络I/O - 无明显变化 性能开销原因分析:
- 新增Container维度的CPI、Container和Pod维度的PSI数据表
- 每cgroup唯一的采集器goroutine带来的性能消耗
- Prometheus上报数据仪表盘带来的少量内存消耗
Case 2:运行Performance Collector后节点开销对比
Performance Collector使用了perf_event_open(2)系统调用,并开启了节点上的PSI功能,现将其对节点影响对比如下:
无明显开销增长:
关键指标 开启前 开启后 内核态CPU使用率 0.94% 0.96% 用户态CPU使用率 24.51% 25.19% 性能开销原因分析:
- perf_event_open(2)的使用
- PSI功能的开启
实例
- 打开想要使用的Performance Collector:
helm install koordinator https://... --set featureGates="CPICollector=true,PSICollector=true"
使用如下flag配置指标采集器的时间窗口、采集间隔等:
flag名称 默认值 含义 -cpi-collector-interval-seconds 60 CPI指标采集的时间间隔,单位为秒 -collect-cpi-timewindow-seconds 10 CPI指标采集的时间窗口,单位为秒 -psi-collector-interval-seconds 10 PSI指标采集的时间间隔,单位为秒 您可以在Prometheus指标暴露端口(默认为9316)处观察到采集到的指标,查询 API为
/metrics,CPI指标以cycles和instructions两条记录分开展示:
$ curl http://localhost:9316/metrics

# HELP koordlet_container_cpi Container cpi collected by koordlet
# TYPE koordlet_container_cpi gauge
koordlet_container_cpi{container_id="containerd://498de02ddd3ad7c901b3c80f96c57db5b3ed9a817dbfab9d16b18be7e7d2d047",container_name="koordlet",cpi_field="cycles",node="your-node-name",pod_name="koordlet-x8g2j",pod_namespace="koordinator-system",pod_uid="3440fb9c-423b-48e9-8850-06a6c50f633d"} 2.228107503e+09
koordlet_container_cpi{container_id="containerd://498de02ddd3ad7c901b3c80f96c57db5b3ed9a817dbfab9d16b18be7e7d2d047",container_name="koordlet",cpi_field="instructions",node="your-node-name",pod_name="koordlet-x8g2j",pod_namespace="koordinator-system",pod_uid="3440fb9c-423b-48e9-8850-06a6c50f633d"} 4.1456092e+09
同时,我们提供ServiceMonitor用于暴露Koordlet采集的指标:
apiVersion: v1
kind: Service
metadata:
labels:
koord-app: koordlet
name: koordlet
namespace: koordinator-system
spec:
clusterIP: None
ports:
- name: koordlet-service
port: 9316
targetPort: 9316
selector:
koord-app: koordlet
---
apiVersion: monitoring.coreos.com/v1
kind: ServiceMonitor
metadata:
labels:
koord-app: koordlet
name: koordlet
namespace: koordinator-system
spec:
endpoints:
- interval: 30s
port: koordlet-service
scheme: http
jobLabel: koord-app
selector:
matchLabels:
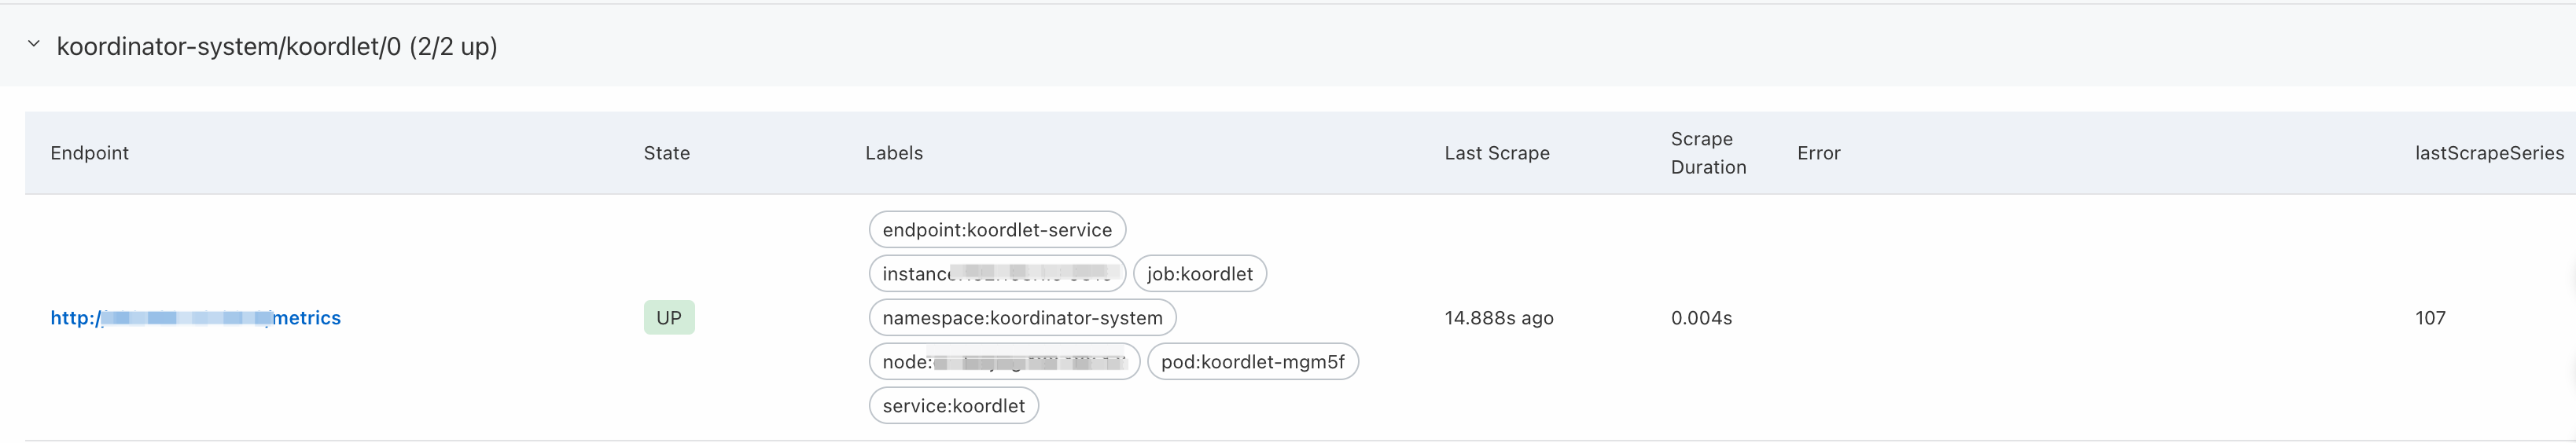
koord-app: koordlet您可以在部署后于Prometheus的Targets中找到并使用: