Device Scheduling - GPU Share With HAMi
Introduction
GPU is an indispensable device for today's large AI model training and inference, and can provide powerful computing power support for AI applications. An NVIDIA A100 80 GB GPU can provide up to 249 times the inference performance on the BERT-LARGE task compared to a CPU. However, behind such powerful computing power is an expensive price. An NVIDIA A100 40GB model GPU chip is priced at around $13,000, while an A100 80GB model GPU chip is priced at around $15,000. We have observed that some inference tasks often use less than a full GPU, but only use, for example, 50% of the computing power or gpu memory. Therefore, sharing a GPU with multiple Pods can significantly improve GPU resource utilization.
HAMi is a Cloud Native Computing Foundation sandbox project which provides the ability to share Heterogeneous AI devices among tasks. Koordinator takes advantage of HAMi's GPU isolation capabilities on the node side to provide an end-to-end GPU sharing solution. It includes two key components:
- HAMi-core is the in-container gpu resource controller, it operates by Hijacking the API-call between CUDA-Runtime(libcudart.so) and CUDA-Driver(libcuda.so). The output from building HAMi-core is libvgpu.so.
- vGPUmonitor is a vGPU monitoring service provided by HAMi. HAMi-core writes vGPU monitoring data to the /usr/local/vgpu/containers directory, and vGPUmonitor parses the data in this directory to export Prometheus metrics.
Setup
Prerequisite
- Kubernetes >= 1.18
- Koordinator >= 1.7
Installation
Please make sure Koordinator components are correctly installed in your cluster. If not, please refer to Installation.
Runtime Requirements
The scheduled GPU devices are bound to the container requires support from the runtime environment. Currently, there are two solutions to achieve this:
| Runtime Environment | Installation |
|---|---|
| Containerd >= 1.7.0 Koordinator >= 1.7 | Please make sure NRI is enabled in containerd. If not, please refer to Enable NRI in Containerd |
Configurations
- DeviceScheduling is Enabled by default. You can use it without any modification on the koord-scheduler config.
- The GPUEnvInject FeatureFG need to be enabled in koordlet. Add
-feature-gates=GPUEnvInject=trueto the args parameters. - 从 Koordinator v1.7 开始,koord-manager 的
EnableSyncGPUSharedResource默认设置为false。在 GPU 共享场景下,需要将该值设置为true。可以通过在 koord-manager 的 args 参数中添加-feature-gates=EnableSyncGPUSharedResource=true来启用。
Install hami-daemon with helms
hami-daemon can be simply installed by helm v3.5+, which is a simple command-line tool, and you can get it from here.
# Firstly add koordinator charts repository if you haven't do this.
$ helm repo add koordinator-sh https://koordinator-sh.github.io/charts/

# [Optional]
$ helm repo update

# Install the latest version.
$ helm install hami-daemon koordinator-sh/hami-daemon --version 0.1.0
Options: chart parameters
Note that installing this chart directly means it will use the default template values for hami-daemon.
You may have to set your specific configurations if it is deployed into a production cluster.
The following table lists the configurable parameters of the chart and their default values.
| Parameter | Description | Default |
|---|---|---|
daemon.affinity | Affinity policy for the hami-daemon pod | Please view the values.yaml file in the chart |
daemon.tolerations | Toleration policy for the hami-daemon pod | Please view the values.yaml file in the chart |
daemon.hamiCore.libvgpuSoVersion | The version number of the libvgpu.so file | v2.6.0 |
daemon.hamiCore.image.repository | Repository for hami image | docker.m.daocloud.io/projecthami/hami |
daemon.hamiCore.image.tag | Tag for hami image | v2.6.0 |
daemon.hamiCore.imagePullPolicy | Image pull policy | IfNotPresent |
daemon.hamiCore.resources | HAMi resource request quantity | Please view the values.yaml file in the chart |
daemon.vgpuMonitor.enabled | Whether to enable vGPU monitor | true |
Specify each parameter using the --set key=value[,key=value] argument to helm install or helm upgrade.
Use GPU Share With HAMi
- Create a Pod to apply for a GPU card with 50% computing power and 50% gpu memory, and specify the need for hami-core isolation through the Pod Label
koordinator.sh/gpu-isolation-provider=HAMi-core. Starting from version 1.7.0, the scheduler will enforce a mandatory check: for any Pod requiring GPU isolation capabilities, its target node must have the hami-core component installed. Please ensure that all nodes in the cluster with hami-core installed are labeled withkoordinator.sh/gpu-isolation-provider=HAMi-core.
apiVersion: v1
kind: Pod
metadata:
  name: pod-example
  namespace: default
  labels:
    koordinator.sh/gpu-isolation-provider: HAMi-core
spec:
  schedulerName: koord-scheduler
  containers:
  - command:
    - sleep
    - 365d
    image: nvidia/cuda:11.8.0-base-ubuntu22.04
    imagePullPolicy: IfNotPresent
    name: curlimage
    resources:
      limits:
        cpu: 4
        memory: 2Gi
        koordinator.sh/gpu.shared: 1
        koordinator.sh/gpu-core: 50
        koordinator.sh/gpu-memory-ratio: 50
      requests:
        cpu: 4
        memory: 2Gi
        koordinator.sh/gpu.shared: 1
        koordinator.sh/gpu-core: 50
        koordinator.sh/gpu-memory-ratio: 50
    terminationMessagePath: /dev/termination-log
    terminationMessagePolicy: File
  restartPolicy: Always
$ kubectl get pod -n default pod-example -o yaml
apiVersion: v1
kind: Pod
metadata:
  annotations:
    scheduling.koordinator.sh/device-allocated: '{"gpu":[{"minor":1,"resources":{"koordinator.sh/gpu-core":"50","koordinator.sh/gpu-memory":"11520Mi","koordinator.sh/gpu-memory-ratio":"50"}}]}'
  name: pod-example
  namespace: default
  labels:
    koordinator.sh/gpu-isolation-provider: HAMi-core
...
You can find the concrete device allocate result through annotation scheduling.koordinator.sh/device-allocated.
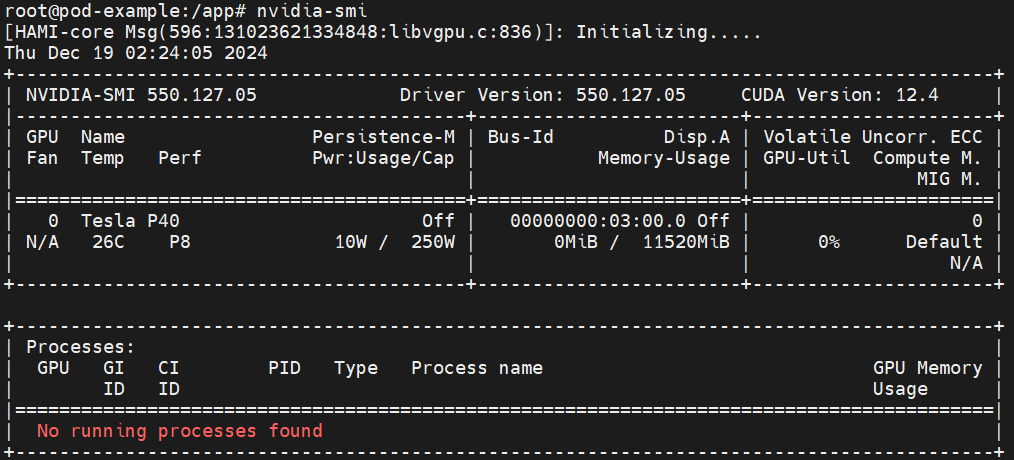
- Enter the pod and you can see that the upper limit of the gpu memory seen by the program inside the pod is the value shown in the allocation result above.
$ kubectl exec -it -n default pod-example bash
View vGPU monitoring
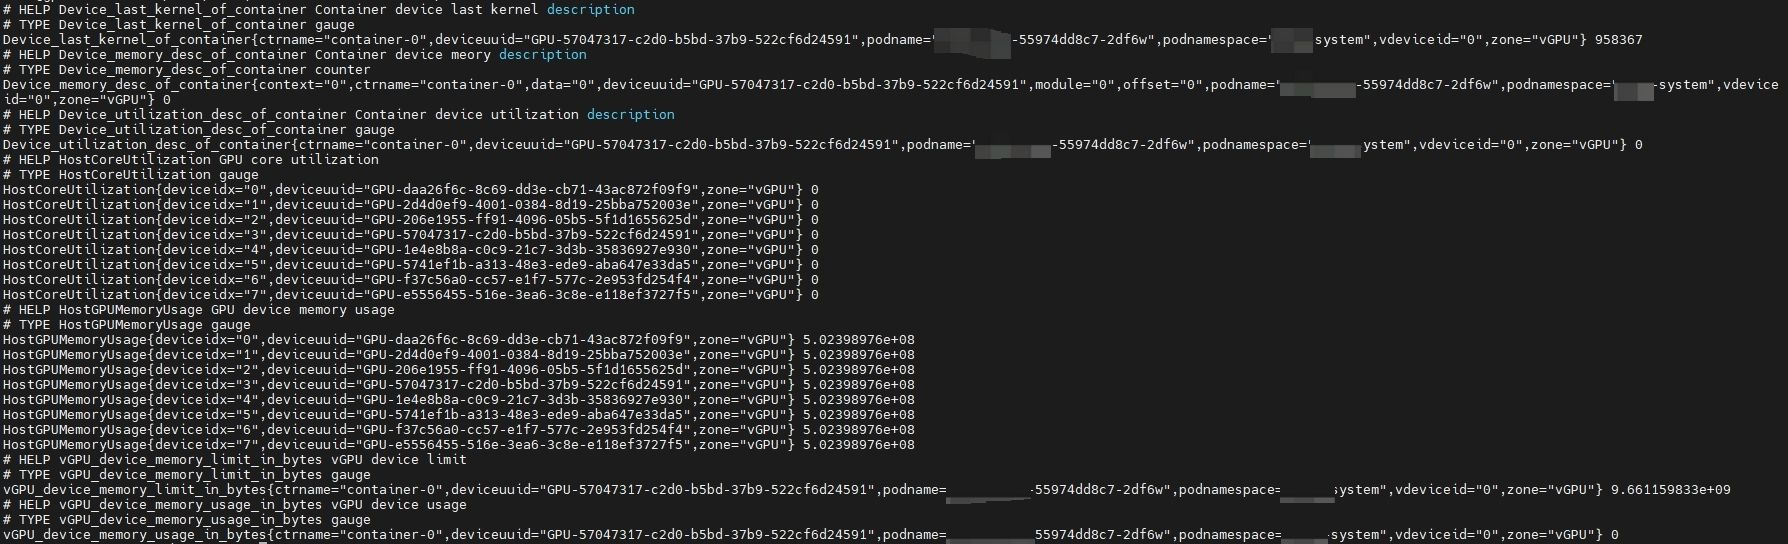
If the vgpuMonitor is enabled during the installation of hami-daemon and a default Prometheus is present in the cluster, then vGPU-related metrics can be queried from Prometheus.
| Metrics Name | Description |
|---|---|
HostGPUMemoryUsage | GPU device memory usage |
HostCoreUtilization | GPU core utilization |
vGPU_device_memory_usage_in_bytes | vGPU device usage |
vGPU_device_memory_limit_in_bytes | vGPU device limit |
Device_memory_desc_of_container | Container device memory description |
Device_utilization_desc_of_container | Container device utilization description |
Device_last_kernel_of_container | Container device last kernel description |
For example, accessing port 9394 (curl {pod-ip}:9394/metrics) of a hami-daemon pod allows you to retrieve relevant metrics, as shown below: