Performance Collector
Motivation
In real production environment, the runtime state of a node is a "chaotic system", and application interference caused by resource contention cannot be absolutely avoided. Koordinator is building interference detection and optimization capabilities. By extracting metrics of application running status, real-time analysis and detection are carried out, and more targeted strategies are adopted for target applications and interference sources after interference is discovered.
Koordinator implements a series of Performance Collectors to collect low-level metrics highly correlated with application running status on one node, and expose them through Prometheus to provide support for interference detection capabilities and cluster application scheduling.
Setup
Prerequisite
Kubernetes >= 1.18
Koordinator >= 1.0
To use CPI Collector, make sure your node machine supports Cycles and Instructions Kernel PMU(Performance Monitoring Unit) events.
Use belowing command to check.
$ perf list
List of pre-defined events (to be used in -e):

  branch-instructions OR branches                    [Hardware event]
  branch-misses                                      [Hardware event]
  bus-cycles                                         [Hardware event]
  ...

  cpu-cycles OR cpu/cpu-cycles/                      [Kernel PMU event]
  ...
  instructions OR cpu/instructions/                  [Kernel PMU event]
To use PSI Collector, your Anolis OS needs to enable PSI feature. Please refer to this document.
Installation
Please make sure Koordinator components are correctly installed in your cluster. If not, please refer to Installation.
Feature-gates
Performance Collector is managed by several feature-gates. Koordinator currently supports following collectors:
CPICollector: manages CPI collector. CPI: Cycles Per Instruction.PSICollector:manages PSI collector. PSI: Pressure Stall Information.
Configuration
Performance Collectors are Disabled currently by default. To enable them, just edit Koordlet's feature-gates args.
kubectl edit ds koordlet -n koordinator-system
spec:
  ...
    spec:
      containers:
      - args:
        ...
        # modify here
        # - -feature-gates=BECPUEvict=true,BEMemoryEvict=true,CgroupReconcile=true,Accelerators=true
        - -feature-gates=BECPUEvict=true,BEMemoryEvict=true,CgroupReconcile=true,Accelerators=true,CPICollector=true,PSICollector=true
        ...
Overhead
Koordinator Performance Collector is an important tool for interference detection, and one of its core goals is to collect relevant indicators at low cost. The following shows the system overhead introduced by Koordinator before and after enabling Performance Collector. Users can refer to this test result to use the Performance Collector feature.
Testing Context
- Alibaba Cloud Container Service for Kubernetes (ACK) Managed Kubernetes Cluster:
- Kubernetes version:1.24.6-aliyun.1
- Container Runtime:containerd 1.5.13
- Node Spec:ecs.ebmg6.26xlarge,104 vCPU 384 GiB, OS: Alibaba Cloud Linux 2.1903
- Node pressure:
- Test Pod image:nginx:1.14.2
- Number of Pods on single Node:100 test Pod + 50 system Pod
- Number of Containers on single Node:150
- Node CPU usage: about 25%, use lookbusy-1.4 to generate on each CPU
- Others:
- 100 nginx Pods are managed by a Linux cronjob, which is deleted every five minutes. The Deployment controller rebuild these Pods in time.
- CPI Collector runs in a window of 10 seconds every 60 seconds.
- PSI Collector runs every 10 seconds.
- The test lasts for 1 hour before and after Performance Collector is enabled.
Conclusion
Case 1:Overhead comparison of Koordlet container before and after enabling Performance Collector
Performance Collector runs on the Koordlet component of Koordinator, and the cost of the component is compared as follows:
No significant increase in overall overhead:
Metrics Disable Enable RSS Memory usage 341MiB 366MiB CPU usage 0.5 core 0.6 core Network I/O - no significant change Possible cause of the overhead:
- The new CPI data table of per Container dimension, and new PSI data table of both per Container and per Pod dimension.
- The consumption caused by the collector's goroutine per cgroup.
- The consumption caused by Prometheus Gauge.
Case 2:Overhead comparison of Node before and after enabling Performance Collector
Performance Collector uses the perf_event_open(2) system call, and its impact on the node is compared as follows:
No significant increase in overall overhead:
Metrics Disable Enable System Mode CPU usage 0.94% 0.96% User Mode CPU usage 24.51% 25.19% Possible cause of the overhead:
- Usage of perf_event_open(2)
- Enabling of PSI feature on OS
Example
- To enable Performance Collector:
helm install koordinator https://... --set featureGates="CPICollector=true,PSICollector=true"
Use belowing flags to config collectors' time window or collect intervals:
Flag Default Definition -cpi-collector-interval-seconds 60 Collect cpi interval by seconds -collect-cpi-timewindow-seconds 10 Collect cpi time window by seconds -psi-collector-interval-seconds 10 Collect psi interval by seconds We can see reported metric values at Prometheus port(9316 as default), the API path is
/metrics, e.g., CPI is shown as two records of cycles and instructions:
$ curl http://localhost:9316/metrics

# HELP koordlet_container_cpi Container cpi collected by koordlet
# TYPE koordlet_container_cpi gauge
koordlet_container_cpi{container_id="containerd://498de02ddd3ad7c901b3c80f96c57db5b3ed9a817dbfab9d16b18be7e7d2d047",container_name="koordlet",cpi_field="cycles",node="your-node-name",pod_name="koordlet-x8g2j",pod_namespace="koordinator-system",pod_uid="3440fb9c-423b-48e9-8850-06a6c50f633d"} 2.228107503e+09
koordlet_container_cpi{container_id="containerd://498de02ddd3ad7c901b3c80f96c57db5b3ed9a817dbfab9d16b18be7e7d2d047",container_name="koordlet",cpi_field="instructions",node="your-node-name",pod_name="koordlet-x8g2j",pod_namespace="koordinator-system",pod_uid="3440fb9c-423b-48e9-8850-06a6c50f633d"} 4.1456092e+09
Notice that we also provide ServiceMonitor for Koordlet to evict those metrics:
apiVersion: v1
kind: Service
metadata:
labels:
koord-app: koordlet
name: koordlet
namespace: koordinator-system
spec:
clusterIP: None
ports:
- name: koordlet-service
port: 9316
targetPort: 9316
selector:
koord-app: koordlet
---
apiVersion: monitoring.coreos.com/v1
kind: ServiceMonitor
metadata:
labels:
koord-app: koordlet
name: koordlet
namespace: koordinator-system
spec:
endpoints:
- interval: 30s
port: koordlet-service
scheme: http
jobLabel: koord-app
selector:
matchLabels:
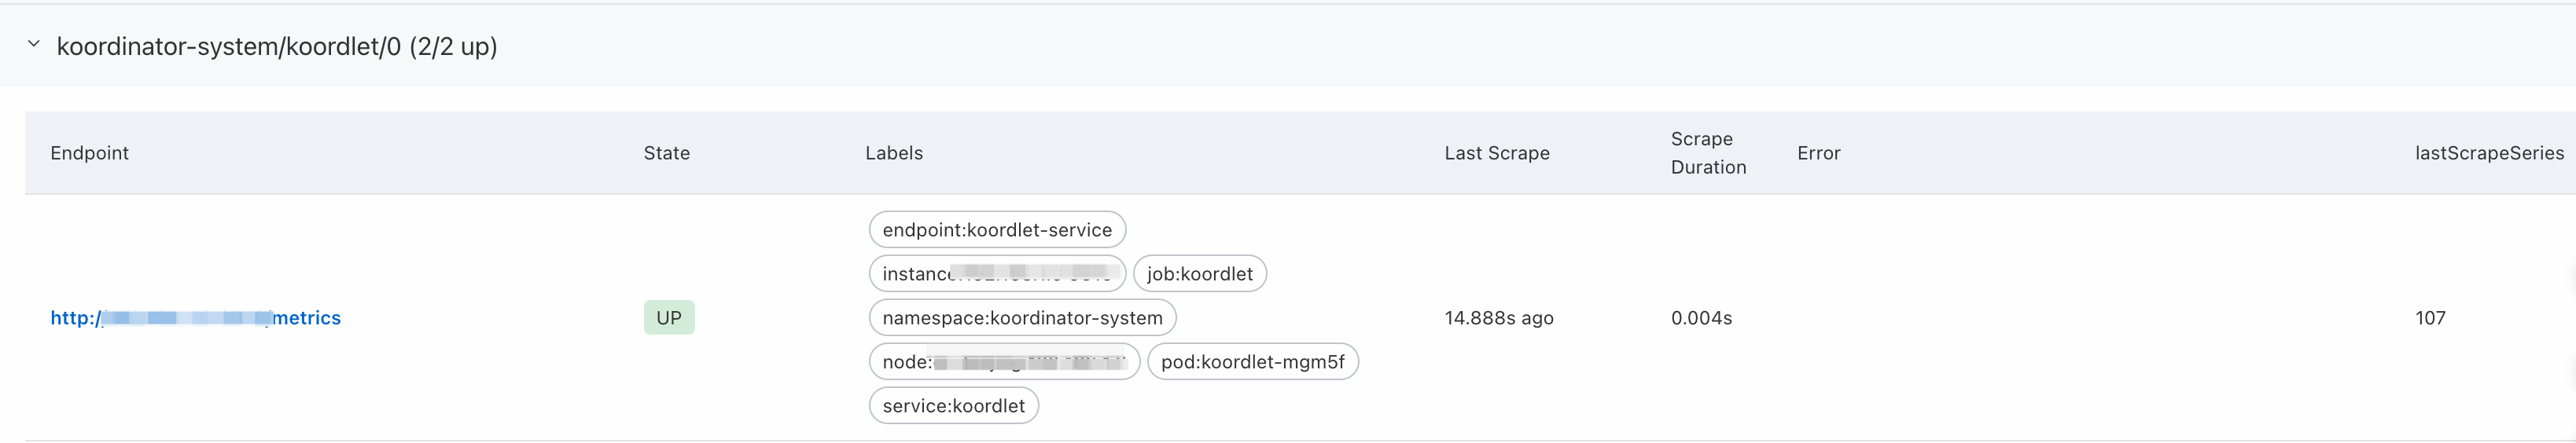
koord-app: koordletYou can find it in Promethues Targets: