Scheduling Monitoring
Introduction
Koordinator provides a Grafana dashboard for monitoring the scheduling performance of koord-scheduler. This dashboard helps you observe key scheduling metrics such as queue status, scheduling latency, scheduling results, preemption, gang scheduling, and more.
The dashboard JSON file is maintained in the Koordinator repository at dashboards/scheduling.json.
Prerequisites
- Koordinator >= 1.8
- Prometheus is deployed and configured to scrape koord-scheduler metrics
- Grafana >= 9.0.0 is deployed and connected to the Prometheus data source
Enable Metrics Collection
To enable Prometheus to scrape koord-scheduler metrics, you need to enable the PodMonitor for koord-scheduler. This can be done by setting scheduler.monitorEnabled=true when installing or upgrading the Koordinator Helm chart:
# Install with PodMonitor enabled
$ helm install koordinator koordinator-sh/koordinator --version 1.8.0 \
  --set scheduler.monitorEnabled=true

# Or upgrade an existing installation
$ helm upgrade koordinator koordinator-sh/koordinator --version 1.8.0 \
  --set scheduler.monitorEnabled=true
This creates a PodMonitor resource that tells the Prometheus Operator to scrape the /metrics endpoint on port 10251 (default) of koord-scheduler pods.
Note: The PodMonitor requires the Prometheus Operator to be installed in your cluster. If you are using a standalone Prometheus without the Operator, you need to manually configure Prometheus to scrape the koord-scheduler metrics endpoint.
Import the Dashboard
Step 1: Download the Dashboard JSON
Download the scheduling dashboard JSON file from the Koordinator repository:
wget https://raw.githubusercontent.com/koordinator-sh/koordinator/main/dashboards/scheduling.json
Step 2: Import into Grafana
- Open Grafana in your browser.
- Navigate to Dashboards → Import (or click the + icon in the left sidebar and select Import).
- Click Upload JSON file and select the downloaded
scheduling.jsonfile. - Select the Prometheus data source that scrapes koord-scheduler metrics.
- Click Import.
Step 3: Configure Variables
After importing, the dashboard provides the following template variables:
| Variable | Description | Default |
|---|---|---|
datasource | The Prometheus data source to query | Auto-detected |
job | The Prometheus job label for koord-scheduler | koord-scheduler |
Adjust these variables at the top of the dashboard to match your environment.
Dashboard Panels
The scheduling dashboard includes the following sections:
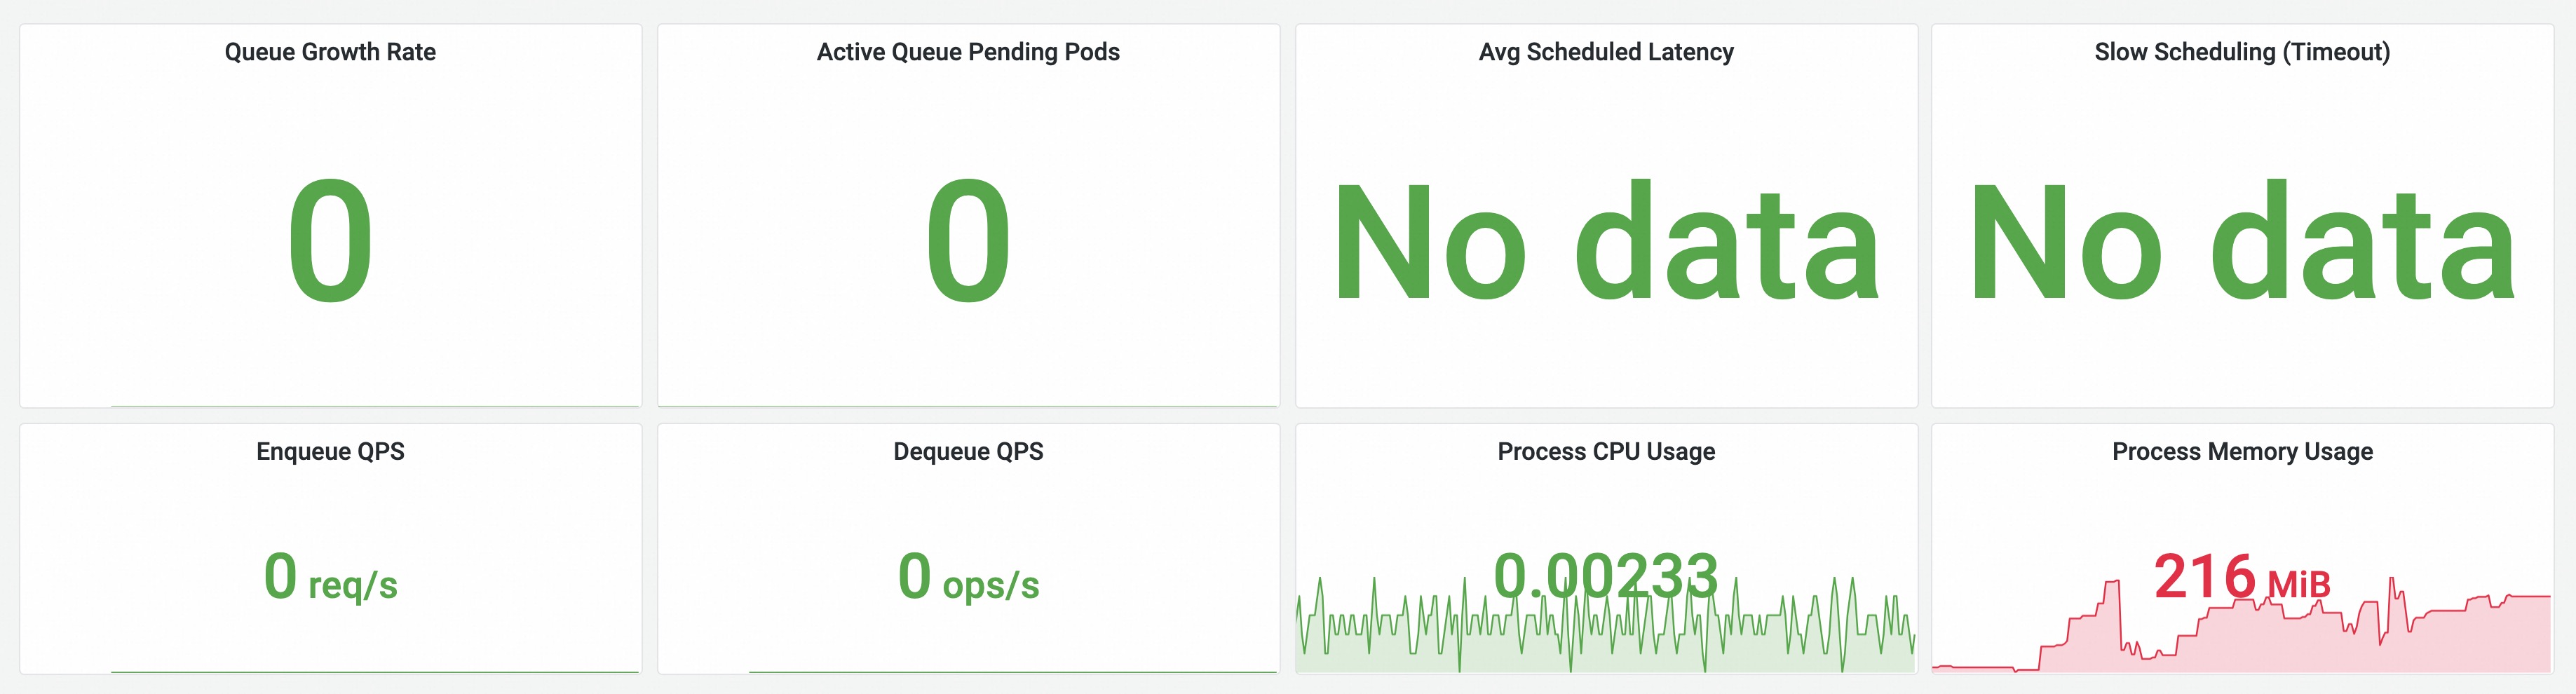
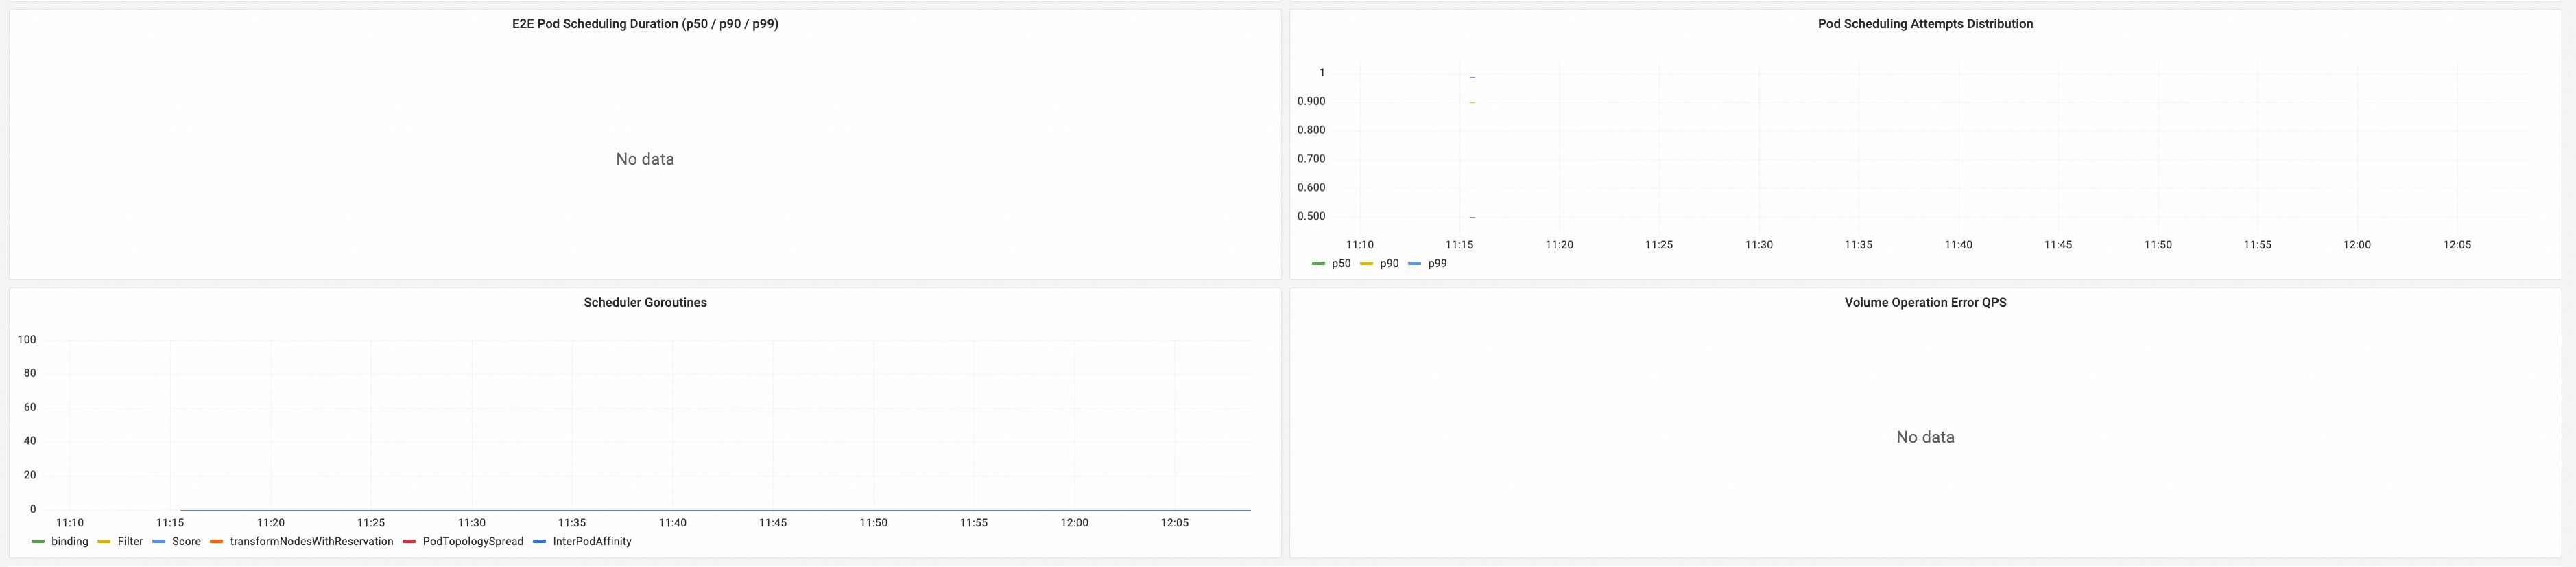
Basic Summary
Overview of the scheduler's health and throughput:
- Queue Growth Rate: The rate at which the scheduling queue is growing (enqueue rate minus dequeue rate).
- Active Queue Pending Pods: Number of pods currently waiting in the active queue.
- Avg Scheduled Latency: Average end-to-end scheduling latency for successfully scheduled pods.
- Slow Scheduling (Timeout): Number of scheduling attempts that timed out.
- Enqueue QPS / Dequeue QPS: Queue throughput metrics.
- Process CPU / Memory Usage: Resource consumption of the scheduler process.
Scheduler Summary
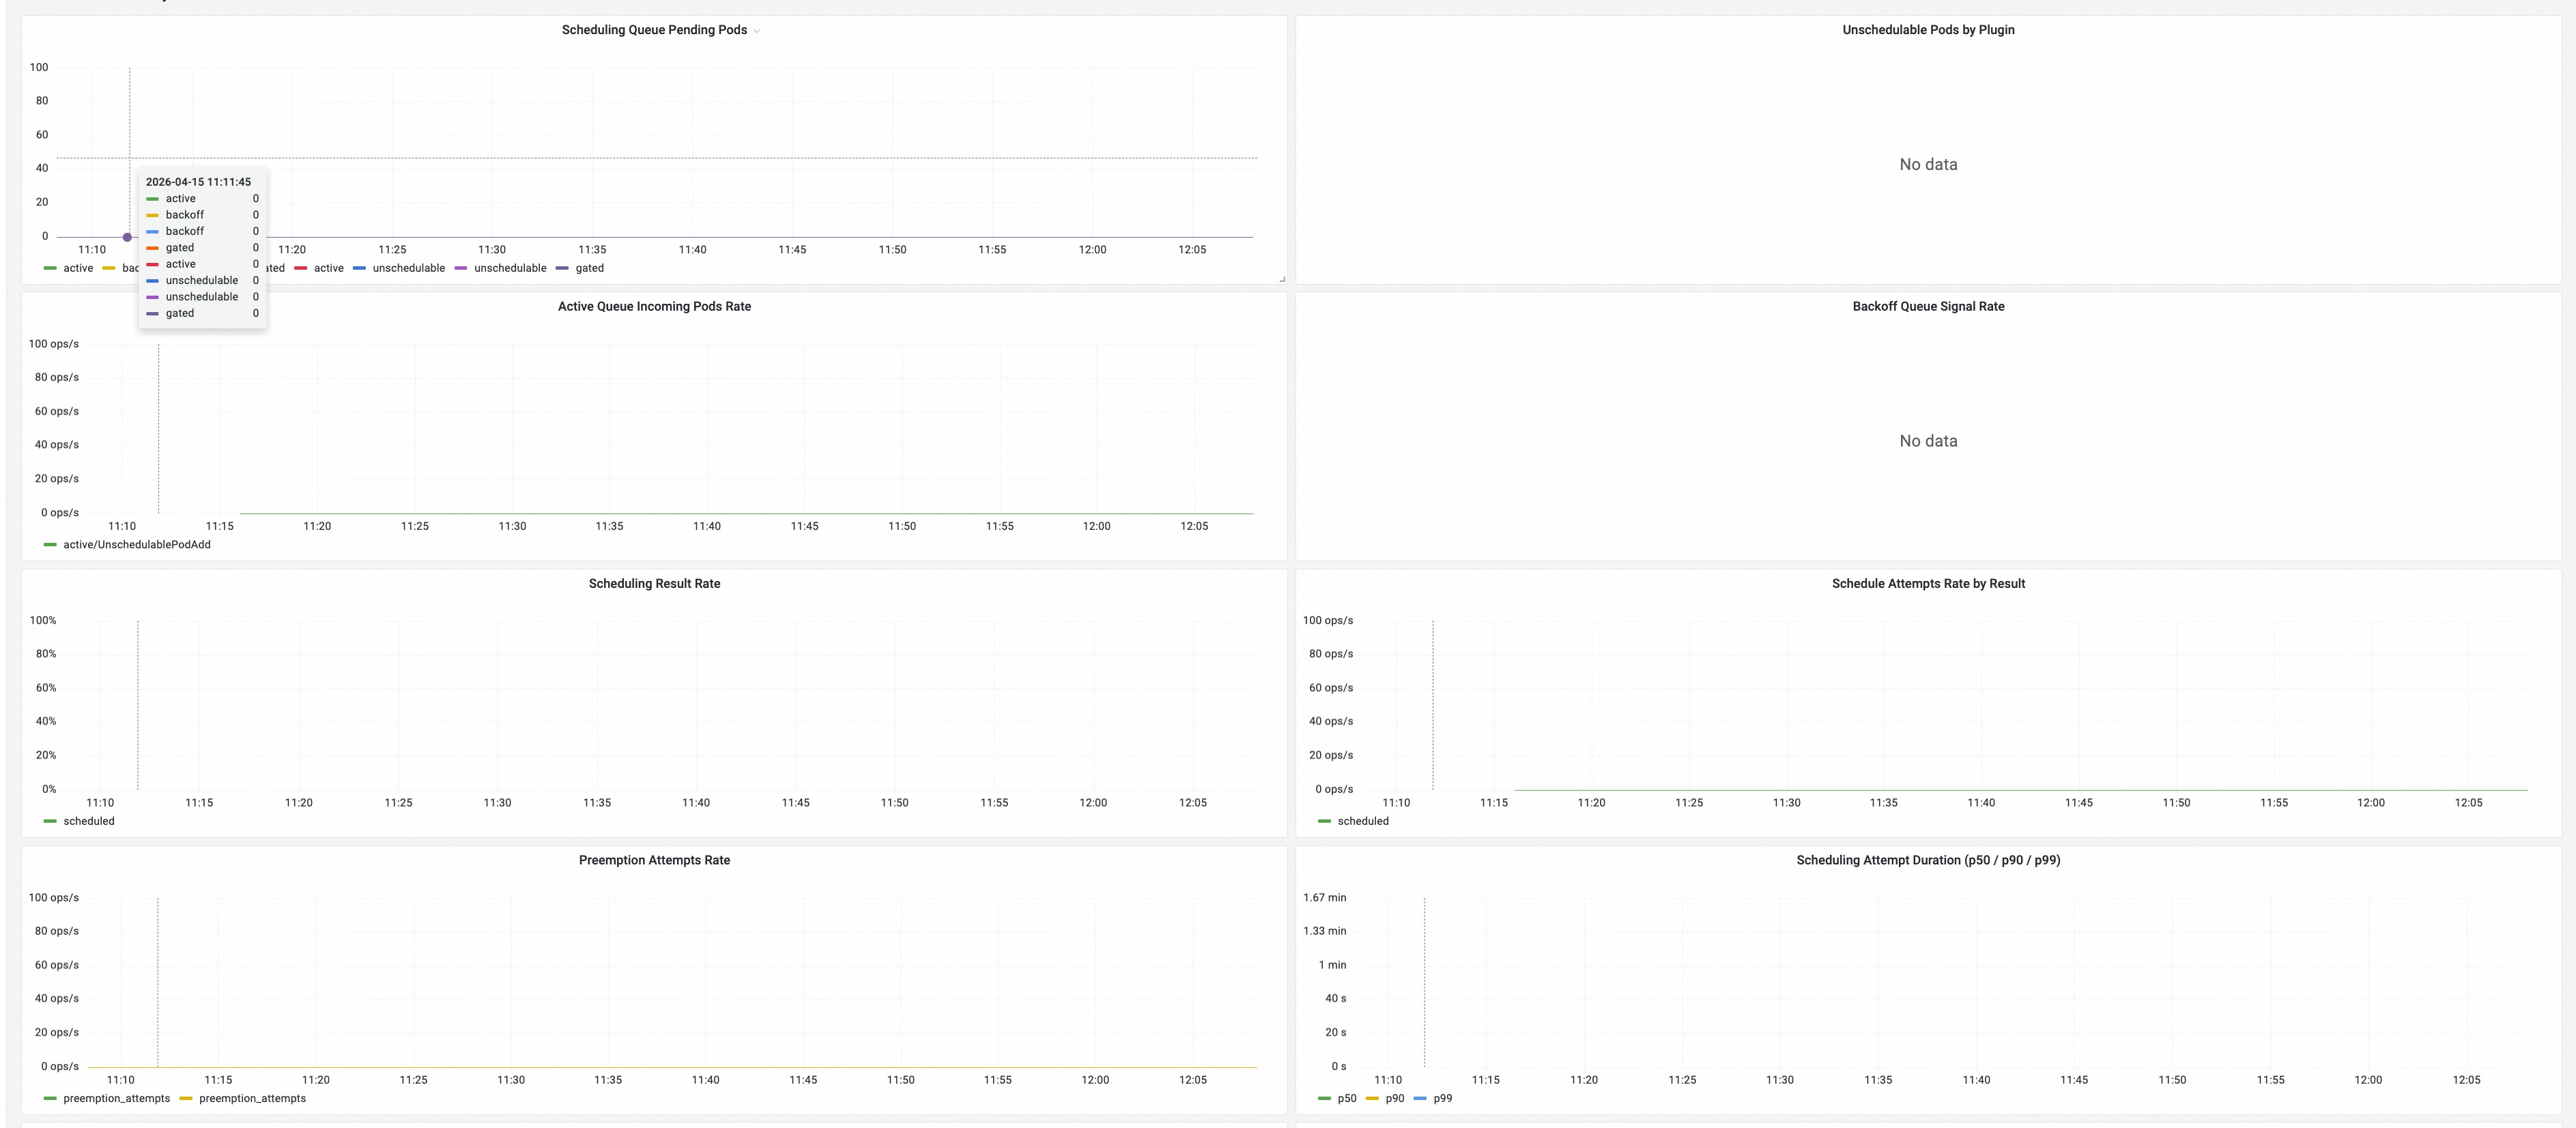
Detailed scheduling pipeline metrics:
- Scheduling Queue Pending Pods: Pods pending in active, backoff, and unschedulable queues.
- Unschedulable Pods by Plugin: Which scheduler plugins are causing pods to be unschedulable.
- Active Queue Incoming Pods Rate: Rate of pods entering the active queue, broken down by event type.
- Backoff Queue Signal Rate: Rate of retry signals in the backoff queue.
- Scheduling Result Rate: Success vs. failure rate of scheduling attempts.
- Scheduling Attempts by Result: Number of scheduling attempts categorized by result.
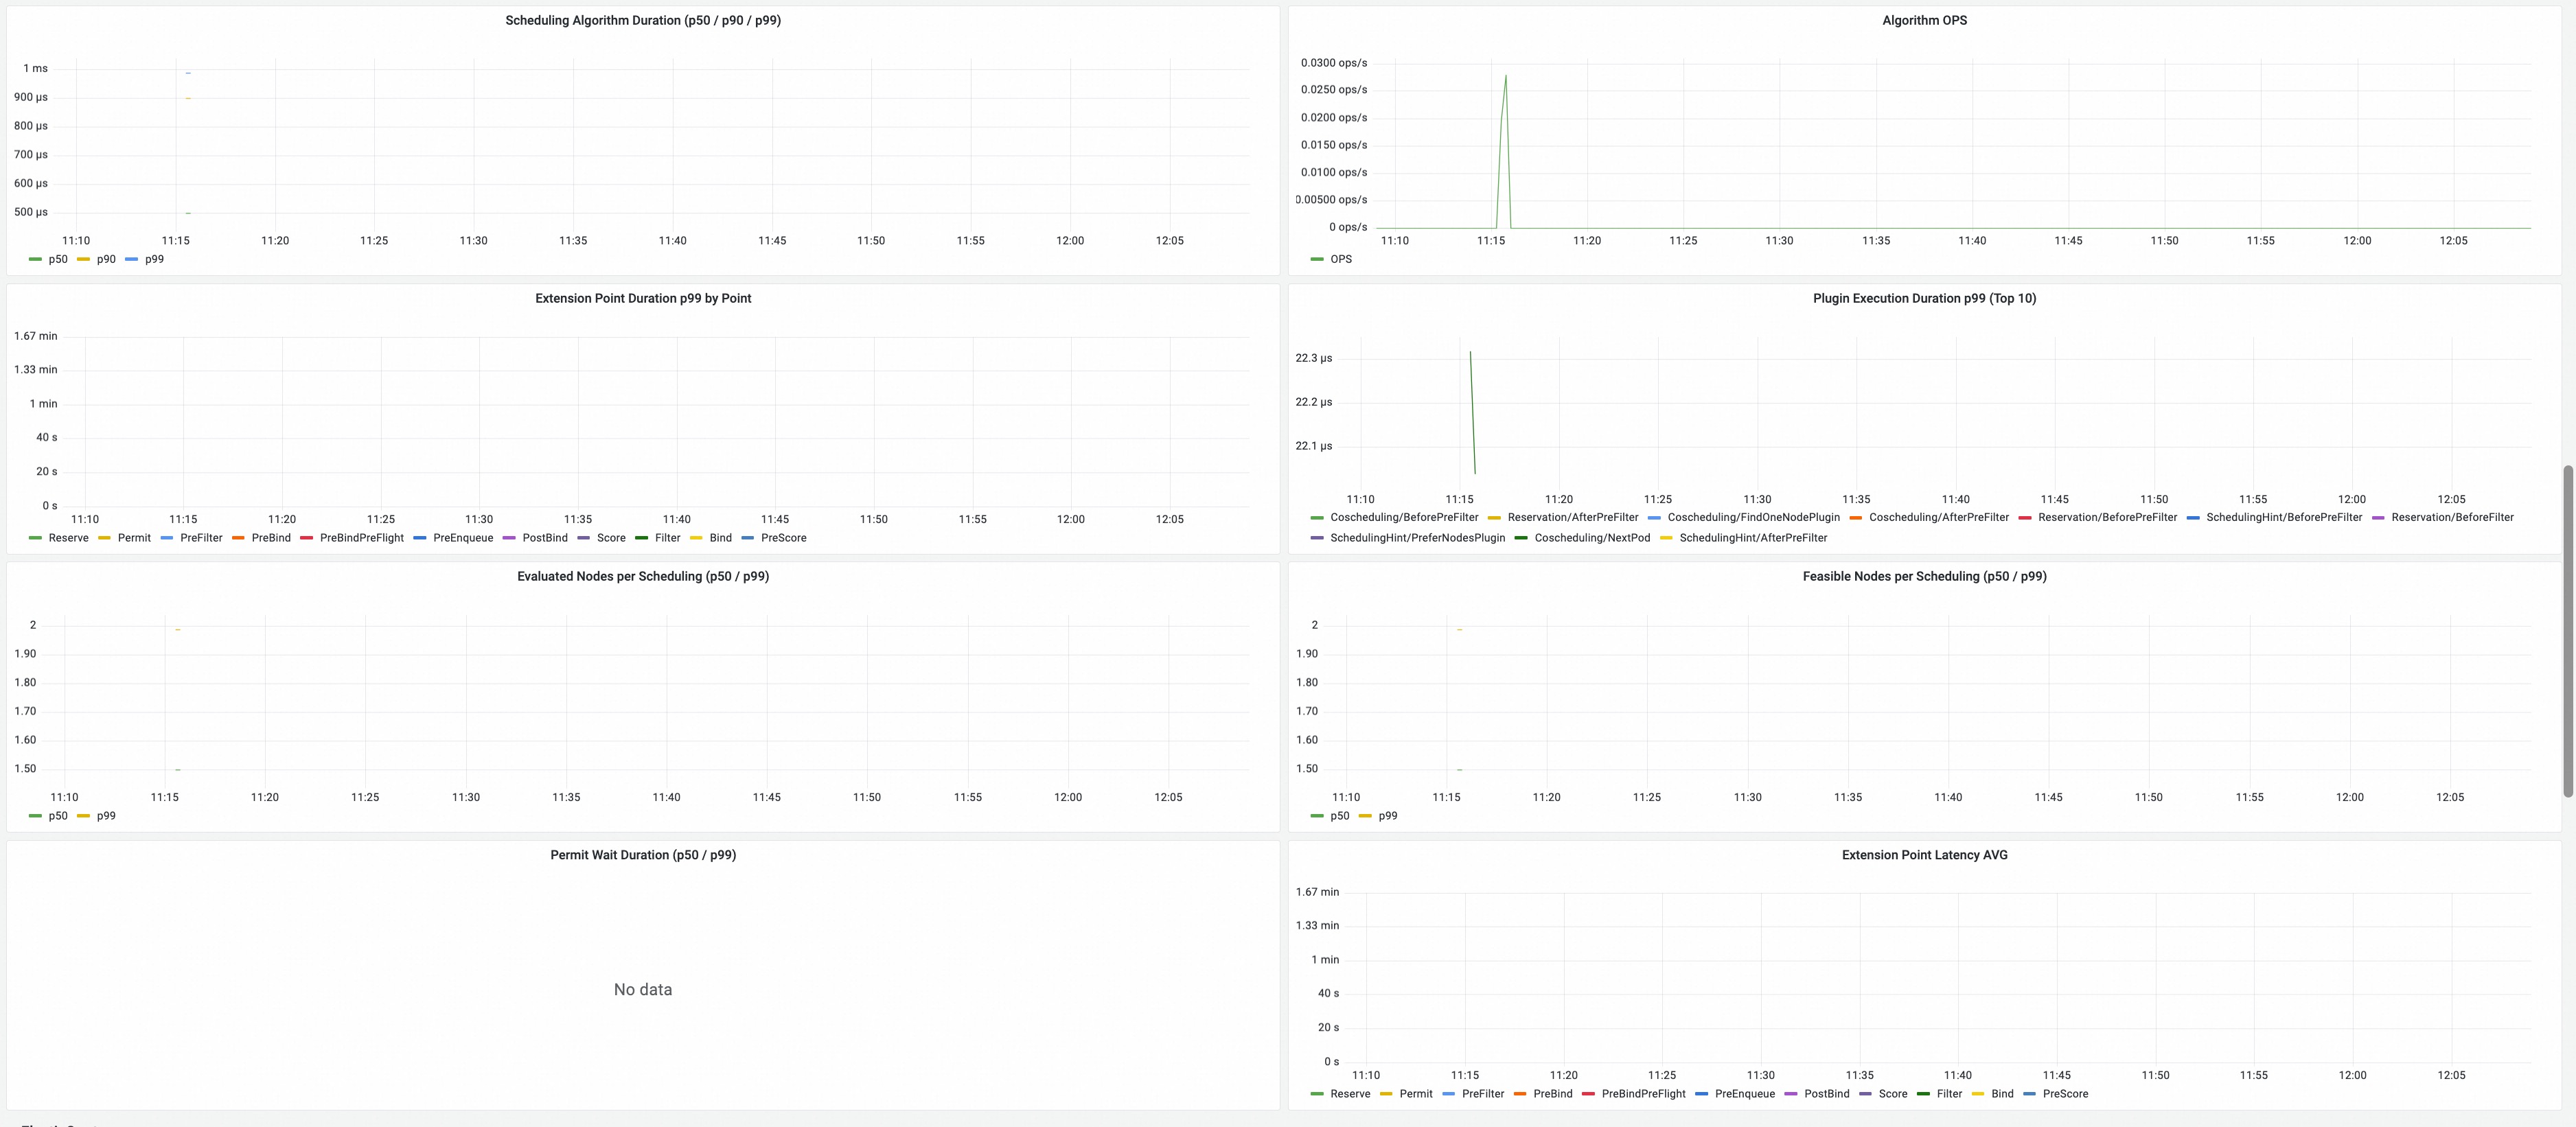
Algorithm Summary
Scheduling algorithm performance:
- Filter / Score / Preemption Latency: Latency distributions for key scheduling phases.
- Plugin Execution Time: Time spent in individual scheduler plugins.
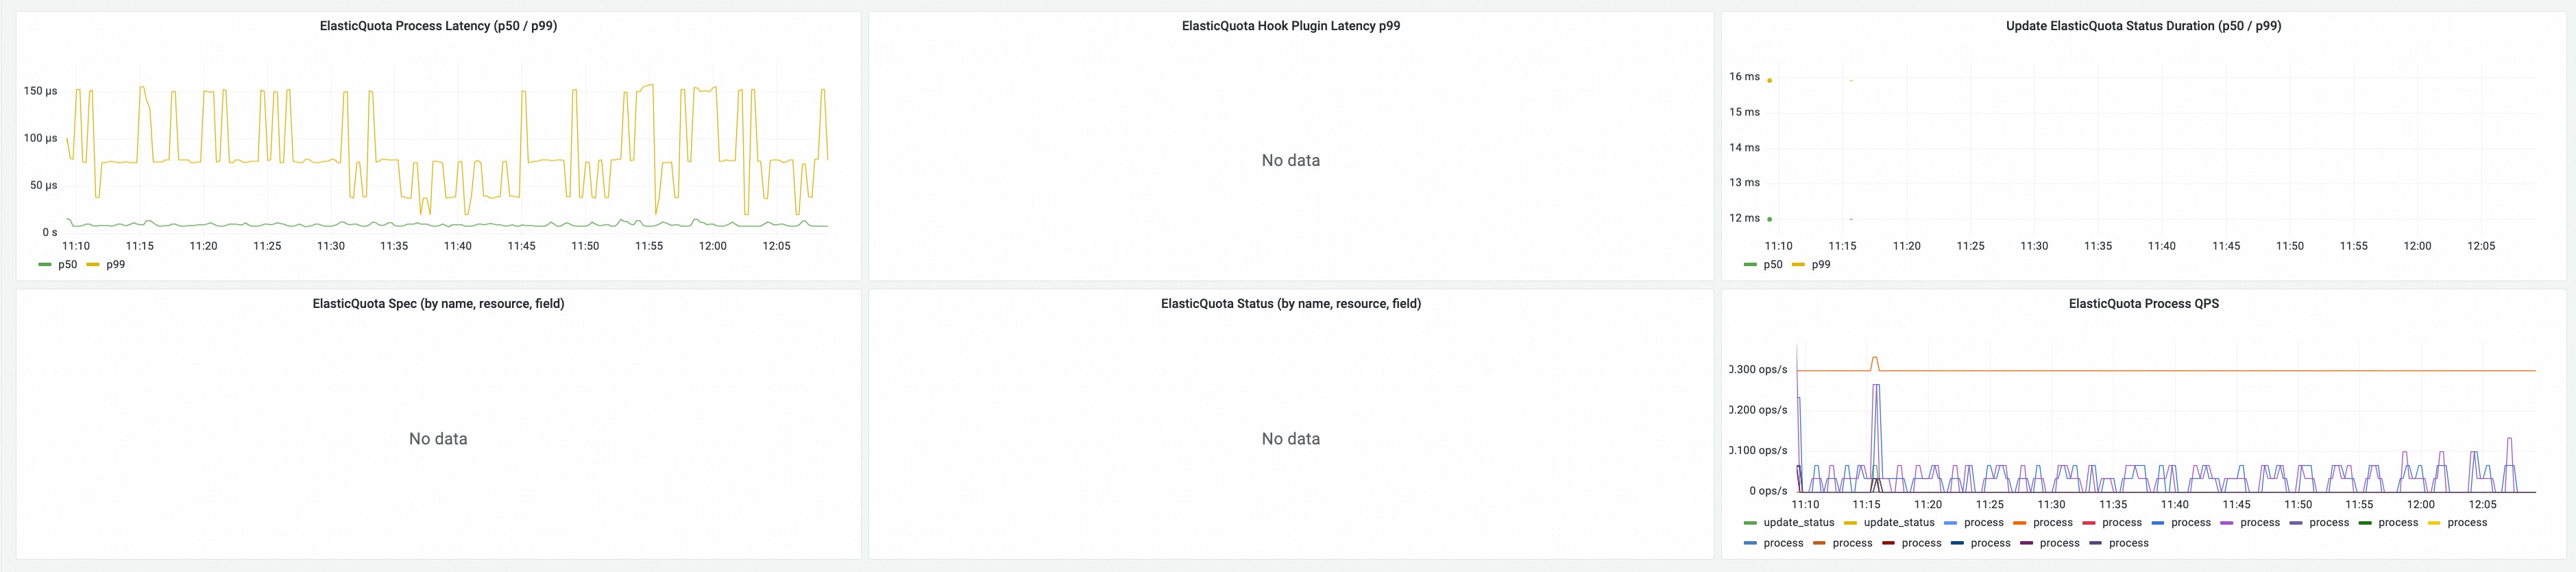
ElasticQuota Summary
Elastic quota scheduling metrics:
- ElasticQuota Usage: Resource usage vs. quota limits across elastic quota groups.
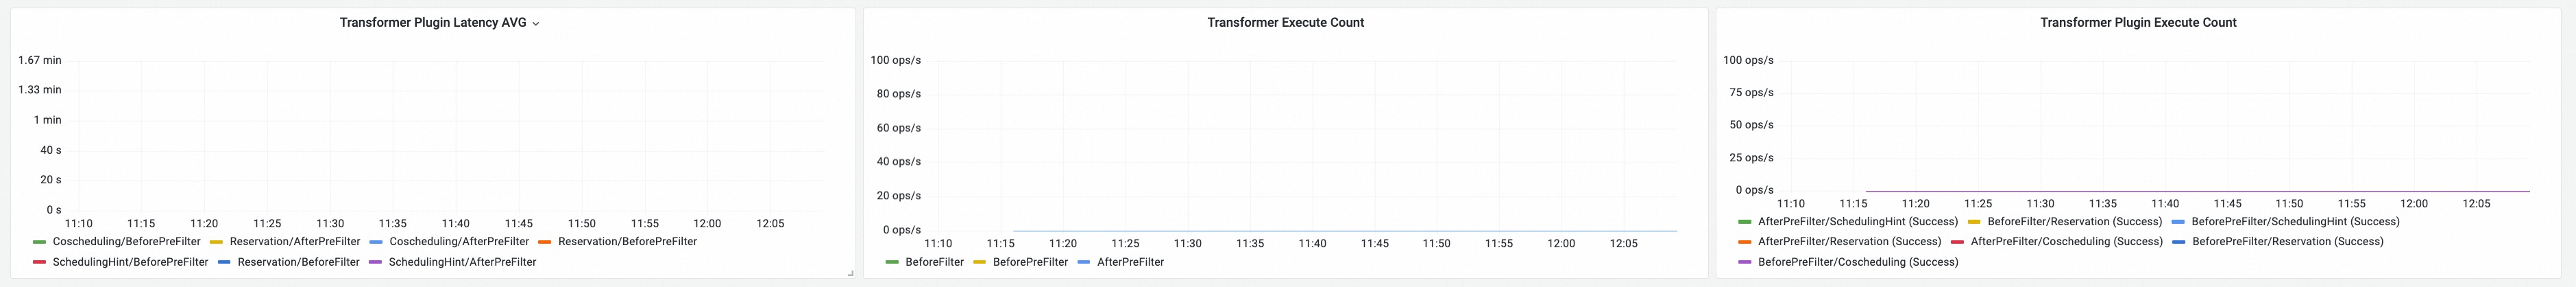
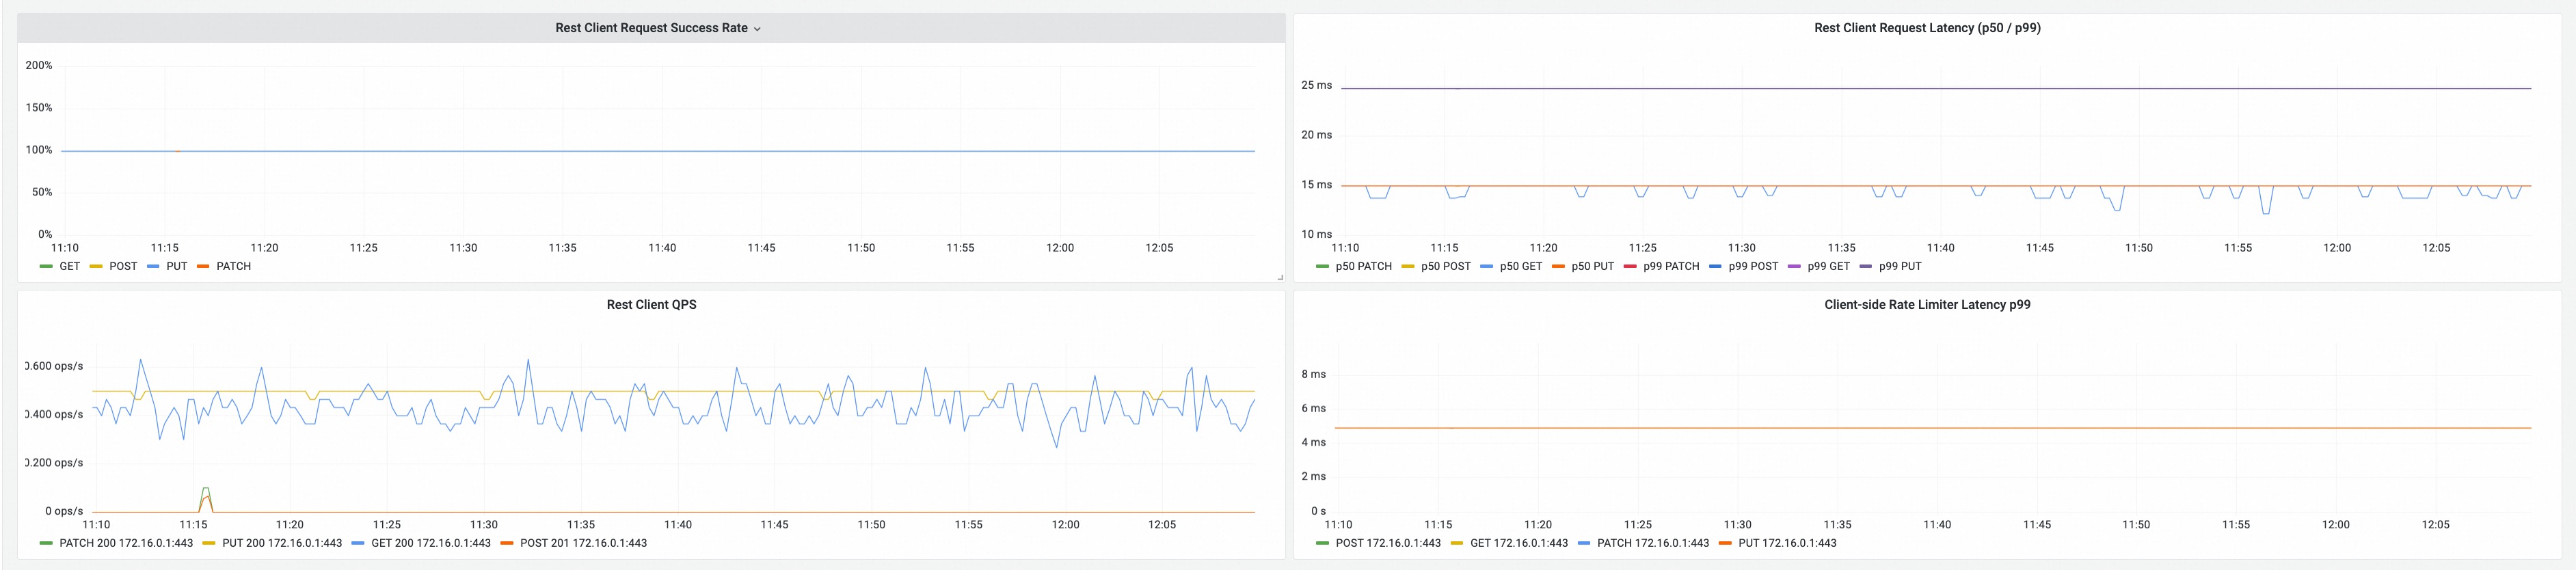
Transformer & Extension Summary
Scheduler extension and transformer metrics:
- Transformer Extension: Metrics related to scheduler transformer extensions.
- Client-Go Summary: Client-go workqueue and request metrics for the scheduler.