Descheduling Monitoring
Introduction
Koordinator provides a Grafana dashboard for monitoring the descheduling (eviction) activities of koord-descheduler. This dashboard helps you observe key descheduling metrics such as eviction counts, success/failure rates, eviction strategies, and per-node/namespace breakdowns.
The dashboard JSON file is maintained in the Koordinator repository at dashboards/descheduling.json.
Prerequisites
- Koordinator >= 1.8
- Prometheus is deployed and configured to scrape koord-descheduler metrics
- Grafana >= 9.0.0 is deployed and connected to the Prometheus data source
Enable Metrics Collection
To enable Prometheus to scrape koord-descheduler metrics, you need to enable the PodMonitor for koord-descheduler. This can be done by setting descheduler.monitorEnabled=true when installing or upgrading the Koordinator Helm chart:
# Install with PodMonitor enabled
$ helm install koordinator koordinator-sh/koordinator --version 1.8.0 \
  --set descheduler.monitorEnabled=true

# Or upgrade an existing installation
$ helm upgrade koordinator koordinator-sh/koordinator --version 1.8.0 \
  --set descheduler.monitorEnabled=true
This creates a PodMonitor resource that tells the Prometheus Operator to scrape the /metrics endpoint on port 10251 (default) of koord-descheduler pods.
Note: The PodMonitor requires the Prometheus Operator to be installed in your cluster. If you are using a standalone Prometheus without the Operator, you need to manually configure Prometheus to scrape the koord-descheduler metrics endpoint.
Import the Dashboard
Step 1: Download the Dashboard JSON
Download the descheduling dashboard JSON file from the Koordinator repository:
wget https://raw.githubusercontent.com/koordinator-sh/koordinator/main/dashboards/descheduling.json
Step 2: Import into Grafana
- Open Grafana in your browser.
- Navigate to Dashboards → Import (or click the + icon in the left sidebar and select Import).
- Click Upload JSON file and select the downloaded
descheduling.jsonfile. - Select the Prometheus data source that scrapes koord-descheduler metrics.
- Click Import.
Step 3: Configure Variables
After importing, the dashboard provides the following template variables:
| Variable | Description | Default |
|---|---|---|
datasource | The Prometheus data source to query | Auto-detected |
job | The Prometheus job label for koord-descheduler | koord-descheduler |
Adjust these variables at the top of the dashboard to match your environment.
Dashboard Panels
The descheduling dashboard includes the following sections:
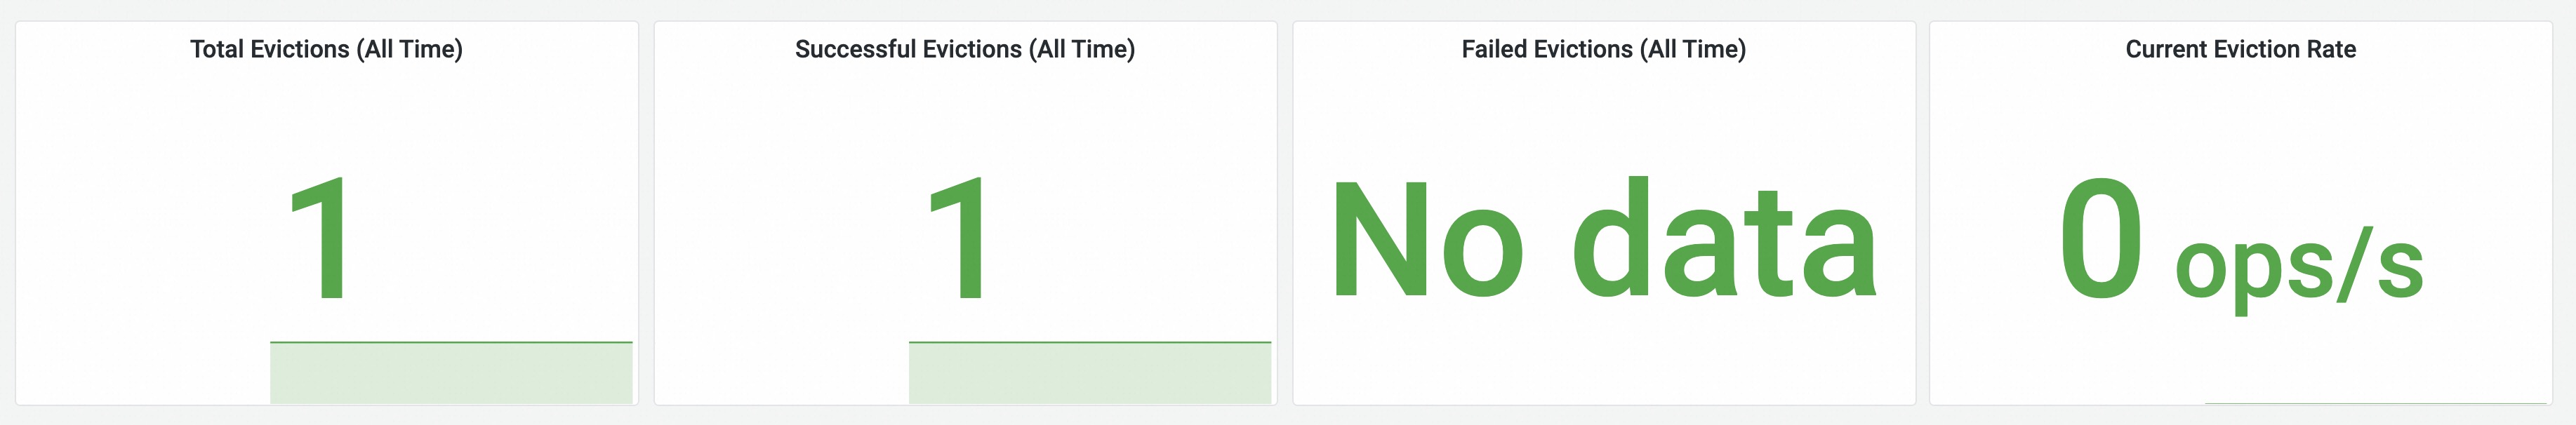
Eviction Overview
High-level eviction statistics:
- Total Evictions (All Time): Cumulative number of eviction attempts.
- Successful Evictions (All Time): Total successful evictions.
- Failed Evictions (All Time): Total failed evictions.
- Current Eviction Rate: Current rate of evictions per second.
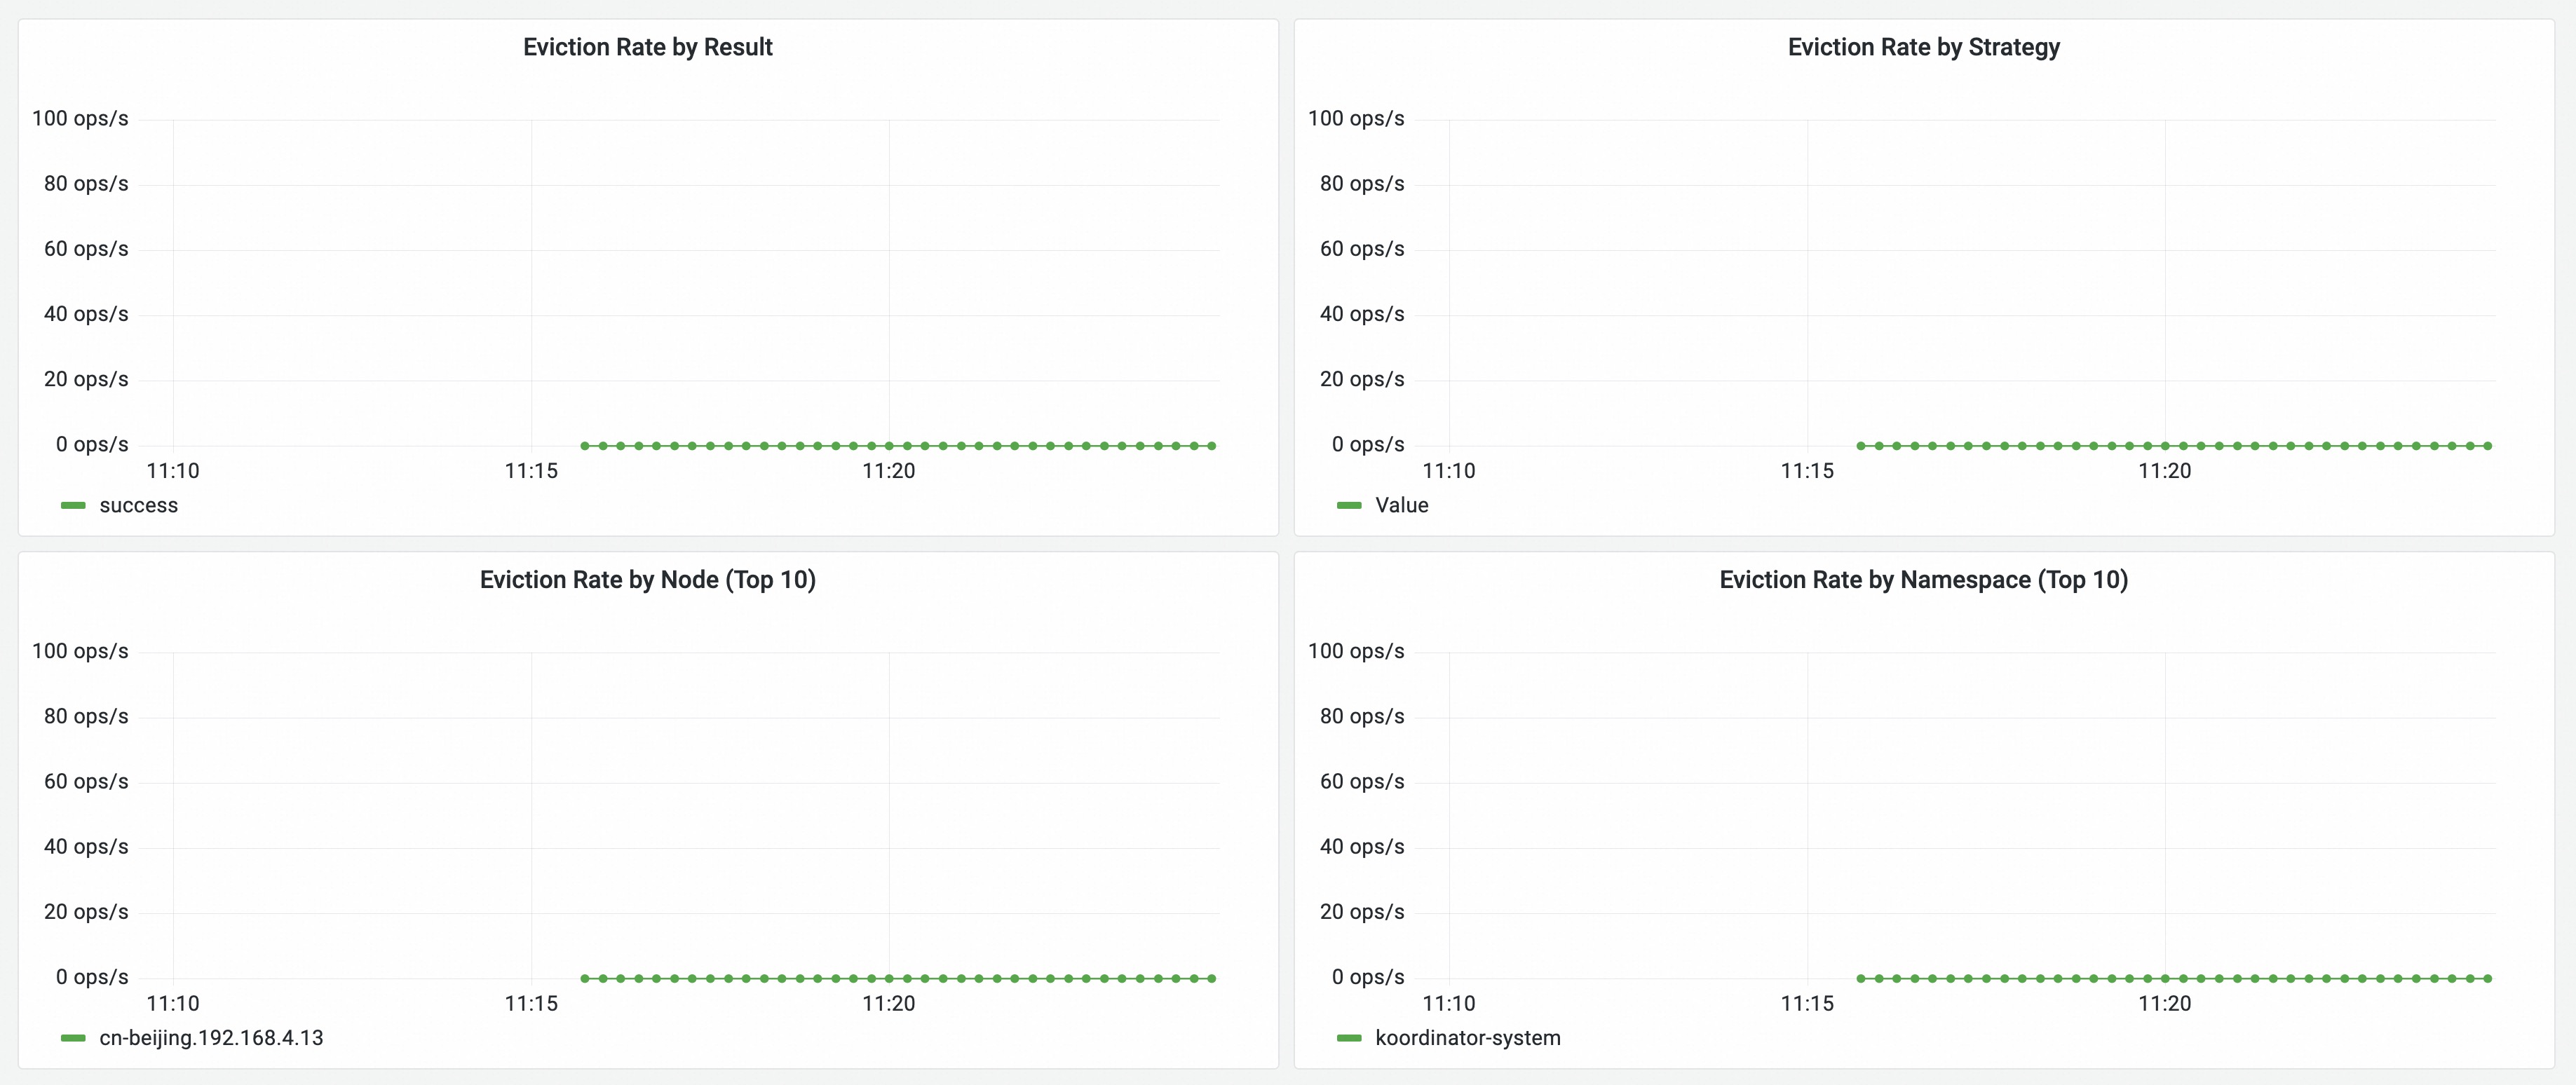
Eviction Rate
Eviction rate trends over time:
- Eviction Rate by Result: Rate of evictions broken down by success/error.
- Eviction Rate by Strategy: Rate of evictions categorized by descheduling strategy (e.g., LowNodeLoad, MigrationController).
- Eviction Rate by Node (Top 10): Top 10 nodes with the highest eviction rate.
- Eviction Rate by Namespace (Top 10): Top 10 namespaces with the highest eviction rate.
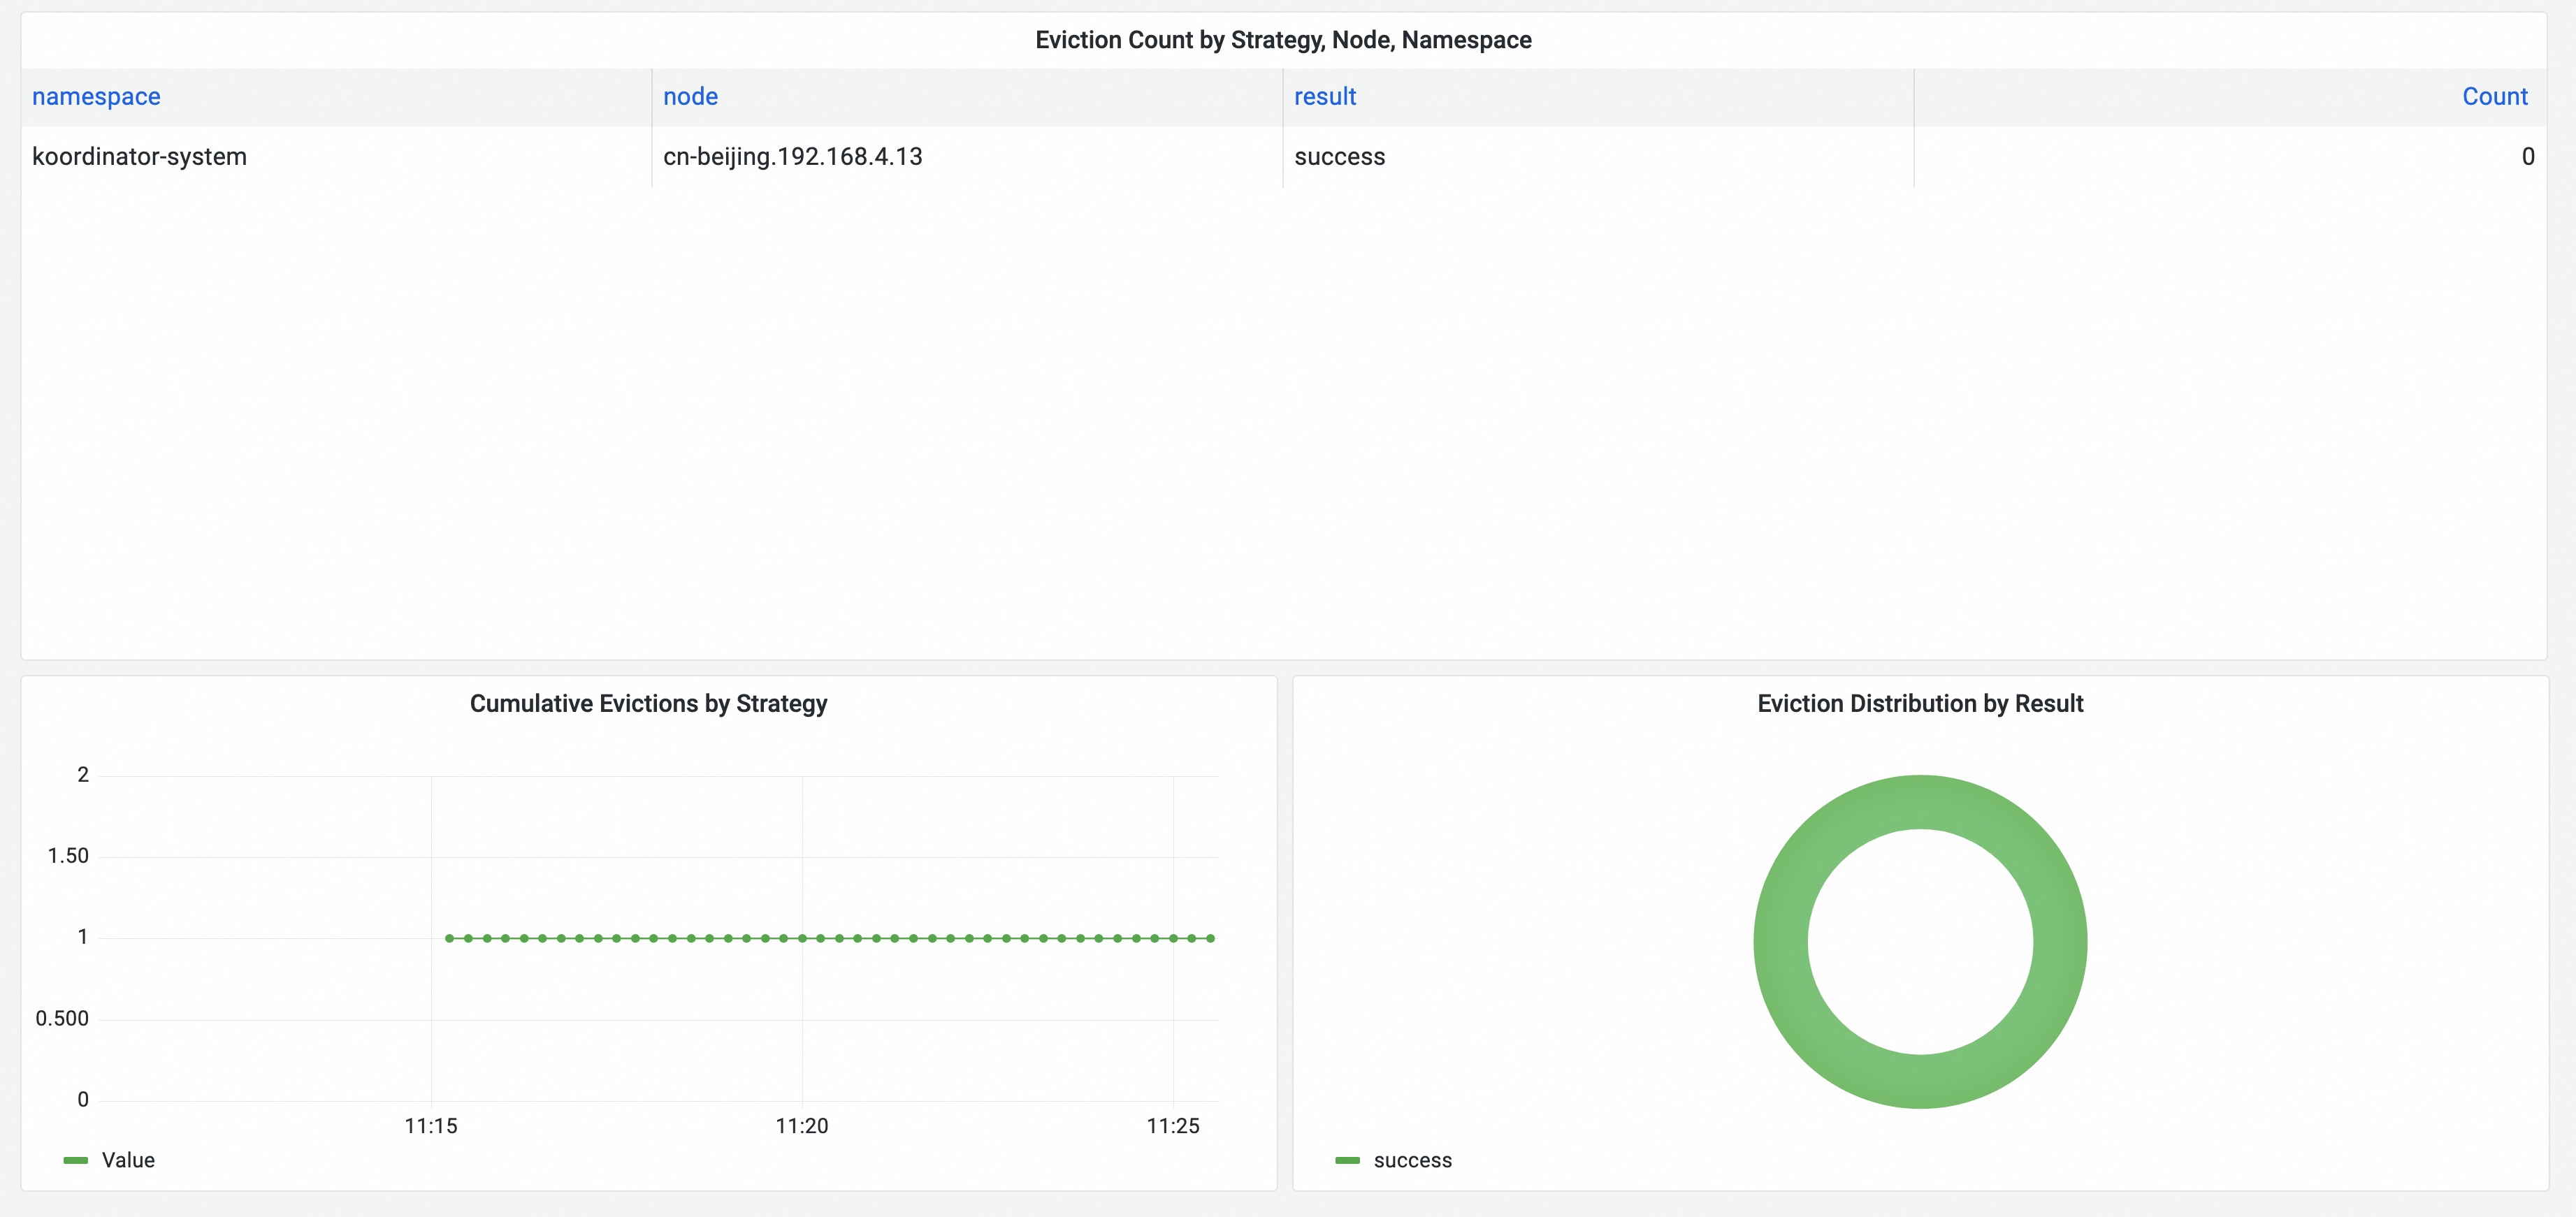
Eviction Breakdown
Detailed eviction distribution:
- Evictions by Strategy (Pie Chart): Proportional breakdown of evictions by descheduling strategy.
- Evictions by Reason (Pie Chart): Proportional breakdown of evictions by reason.
- Eviction Table: Detailed table showing evictions with strategy, namespace, node, result, and reason.
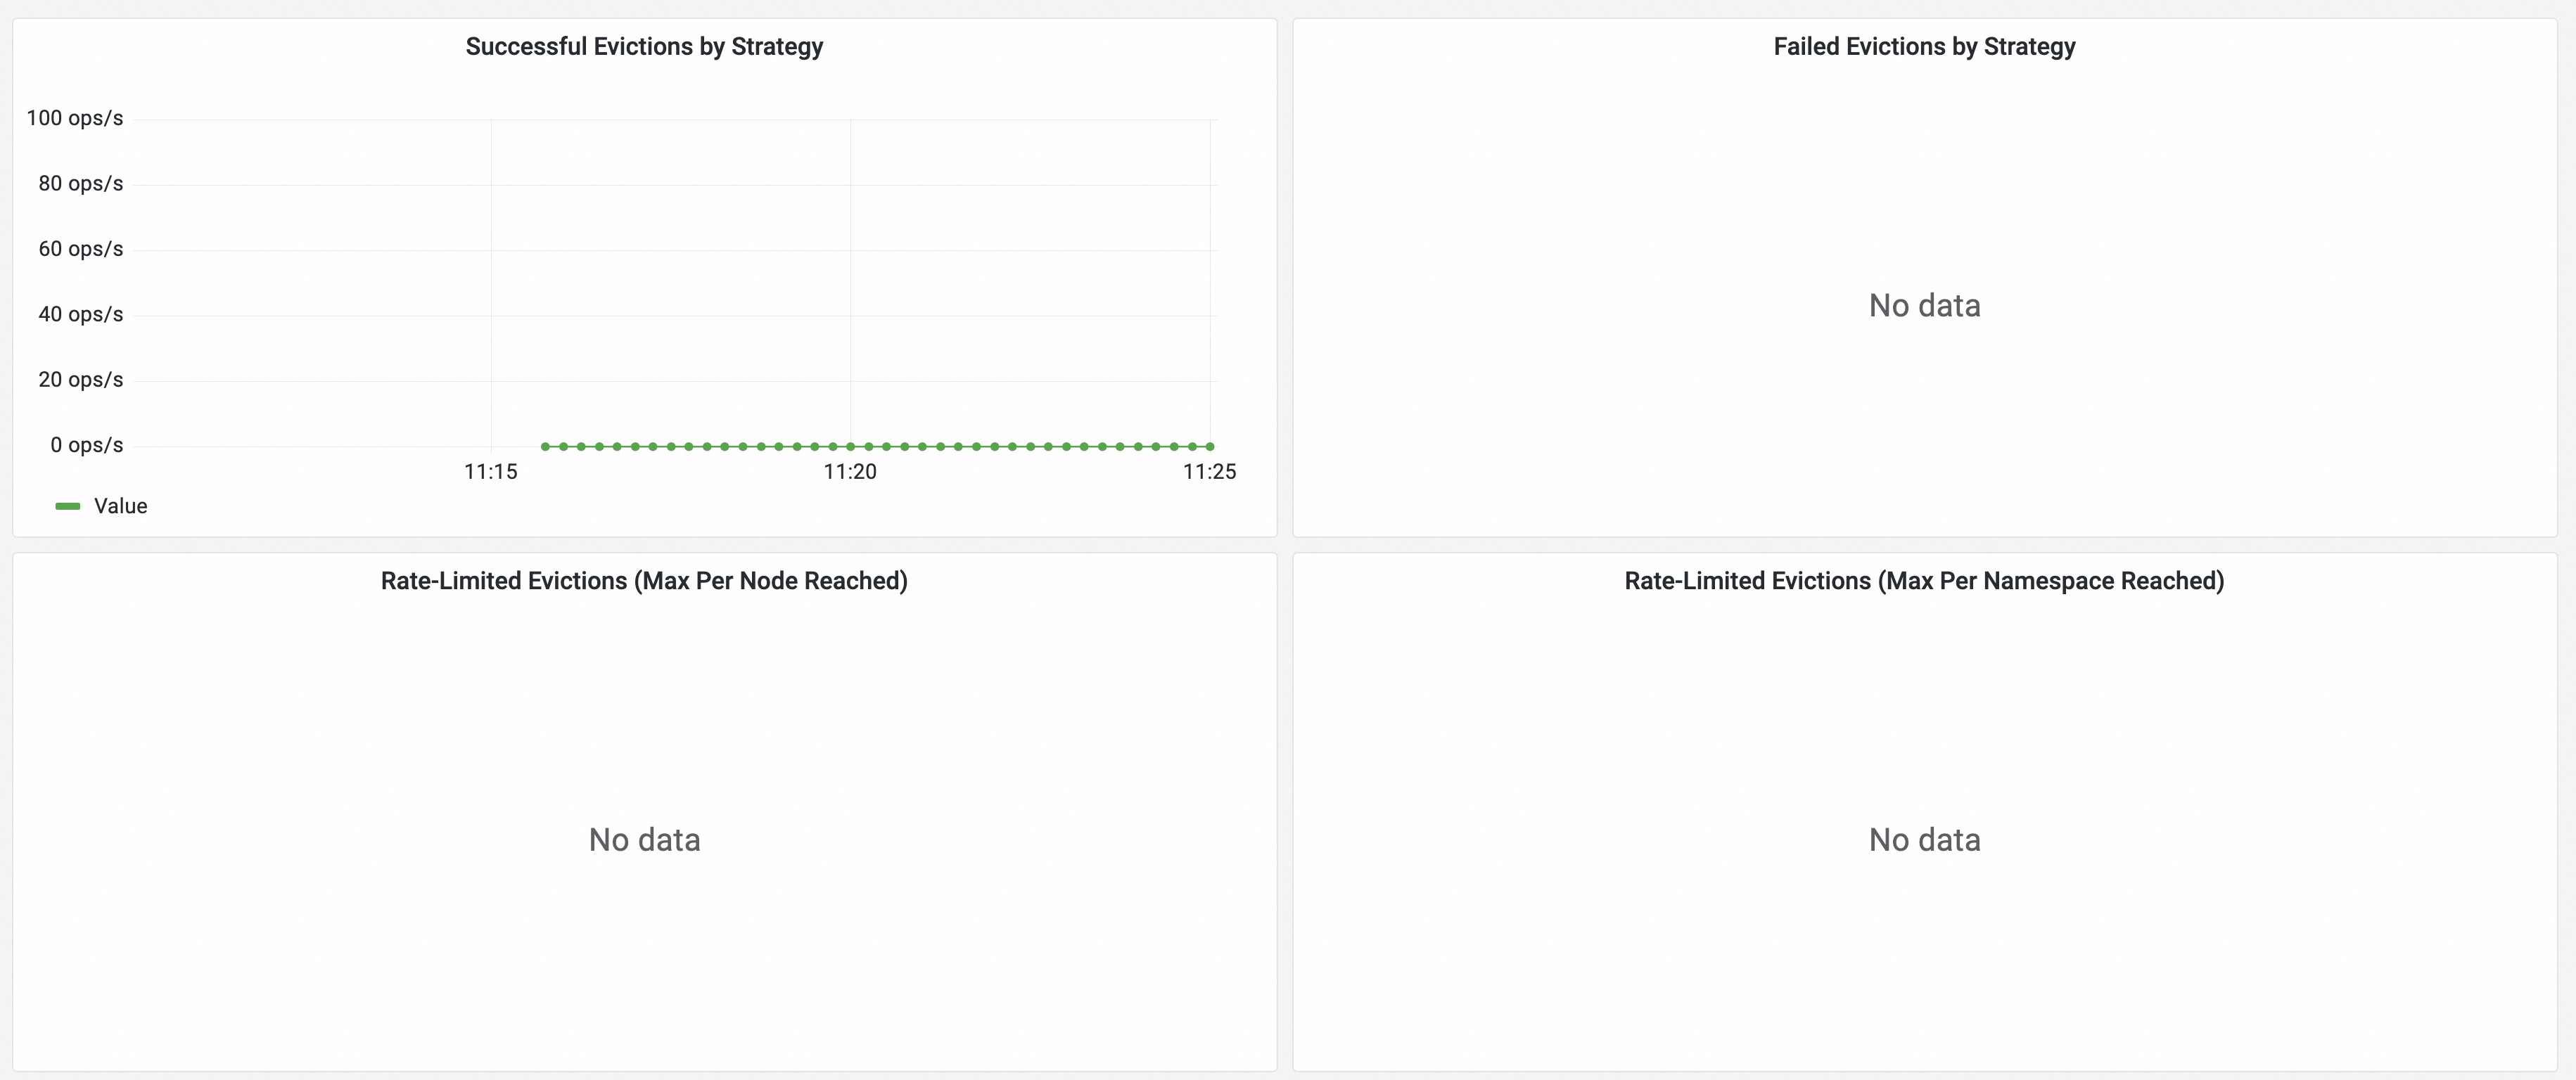
Eviction Detail
Detailed eviction information for troubleshooting:
- Recent Evictions: Time-series view of recent eviction events.
- Eviction Latency: Distribution of eviction processing time.